
Stranger Things: 212,000 Jobless Claims Five Weeks in a Row
Published 21 Apr, 2024
Macro investment researcher Jim Bianco noticed something strange.
"Below is the number of initial filings for unemployment insurance," he posted. "How is this statistically possible? Five of the last six weeks, the exact same number. Effectively the same number in the last 11 weeks, except for the holiday weeks (President's Day and Easter)."
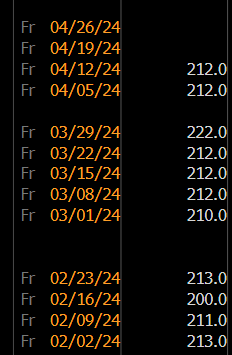
March 30, with 222,000, is the only exception.
Combined with the fact the US has "a $28 trillion economy" and "160 million workers," something is screwy at the Department of Labor.
"Initial claims for unemployment insurance are state programs, with 50 state rules, hundreds of offices, and 50 websites to file. Weather, seasonality, holidays, and economic vibrations drive the number of people filing claims from week to week," Bianco stressed. "Yet this measure is so stable that it does not vary by even 1,000 applications a week. Just the number of applications incorrectly filed out every week should cause it to vary more than this."
As economic indicators go, few carry as much weight as the weekly report on initial jobless claims issued by the United States Department of Labor. This seemingly mundane statistic serves as a crucial barometer for economists, policymakers, and investors alike, offering valuable insights into the health of the labor market and broader economic trends. But how exactly are these figures tabulated, and what do they signify?
Tabulating Initial Jobless Claims
Every week, the US Department of Labor collects data on the number of individuals filing for unemployment benefits for the first time. This information is gathered through state employment offices, where individuals who have recently lost their jobs or have been laid off submit claims for unemployment insurance.
Once collected, the data is compiled and processed by the Department of Labor's Employment and Training Administration. The figures undergo careful scrutiny to ensure accuracy and consistency across states. Any anomalies or irregularities are investigated to maintain the integrity of the reported numbers.
The final tally, released every Thursday morning, represents the number of initial jobless claims filed during the previous week. This figure serves as a crucial indicator of the overall health of the labor market, offering insights into trends such as layoffs, hiring activity, and overall economic stability.
READ Israel Responds to Iran: War and Inflation in the 21st Century
Deciphering the Numbers
For economists, initial jobless claims serve as a leading indicator of labor market conditions. A higher number of claims typically suggests increased layoffs and economic distress, signaling potential weaknesses in employment levels and consumer spending.
Conversely, a decline in initial jobless claims indicates a tightening labor market, with fewer individuals losing their jobs. This can be interpreted as a positive sign of economic strength, potentially leading to higher consumer confidence and increased spending.
Moreover, economists closely analyze the four-week moving average of initial jobless claims to filter out weekly volatility and identify underlying trends. A sustained downward trajectory in the moving average suggests improving labor market conditions, while an uptick may signal emerging challenges.
Beyond its implications for the labor market, initial jobless claims also provide valuable insights into broader economic trends. Changes in unemployment claims can influence monetary policy decisions by the Federal Reserve, as policymakers seek to balance objectives such as price stability and maximum employment.
Historical Perspective
The origins of the weekly jobless claims report can be traced back to the aftermath of the Great Depression in the 1930s. As policymakers sought to address the widespread unemployment crisis, the collection of unemployment data emerged as a critical tool for monitoring economic conditions and guiding policy responses.
Over the decades, the methodology for tabulating initial jobless claims has evolved, reflecting advancements in data collection and statistical analysis. The introduction of electronic filing systems and automated data processing has streamlined the reporting process, allowing for more timely and accurate dissemination of information.
The significance of initial jobless claims gained prominence during periods of economic turmoil, such as the recessions of the early 1980s, the dot-com bubble burst in the early 2000s, and the global financial crisis of 2008. During these periods, spikes in unemployment claims underscored the severity of economic downturns and provided early warnings of impending recessions.
Jobless Claims in the Post-Pandemic Era
In recent years, the COVID-19 pandemic has reshaped the economic landscape, leading to unprecedented levels of job losses and business closures. The weekly jobless claims report took on heightened significance as policymakers and investors closely monitored the impact of the pandemic on employment dynamics.
While initial jobless claims surged to historic highs in the early stages of the pandemic, subsequent declines reflected the gradual recovery of the labor market as businesses reopened and vaccination efforts accelerated. However, lingering challenges, such as labor shortages and supply chain disruptions, have contributed to ongoing volatility in jobless claims data.
Which is all the more reason to puzzle at those five weeks.