Truflation: Contradictions of the CPI
Published 25 Jul, 2022
In his statement on the June CPI report this month, President Joe Biden said,
“While today’s headline inflation reading is unacceptably high, it is also out-of-date.”
We here at Truflation couldn’t agree more, President Biden. Why is the BLS still using data from over a month ago to determine the rate of inflation in the economy? When was this ‘data’ snapshot taken from the economy in June? Your guess, Mr. President, is as good as ours!
When we compare our monthly numbers, nothing makes sense in the BLS. Let’s dive into the numbers and look at the contradictions between our data and the BLS report.
Energy and Food move in tandem
At Truflation, we saw the YoY% inflation rate in food prices peak on 18th June at 12.35%. As of 21st July, food prices as measured by Truflation have decreased by 1.65%. This lag in data collection and reporting means that the headline numbers in the BLS report do not capture how inflation affects what consumers buy on the ground, even when it comes to food. Over the last six months at Truflation, we have seen food peak in April at 12.68% and since then is trending down, mirroring prices at the pump.
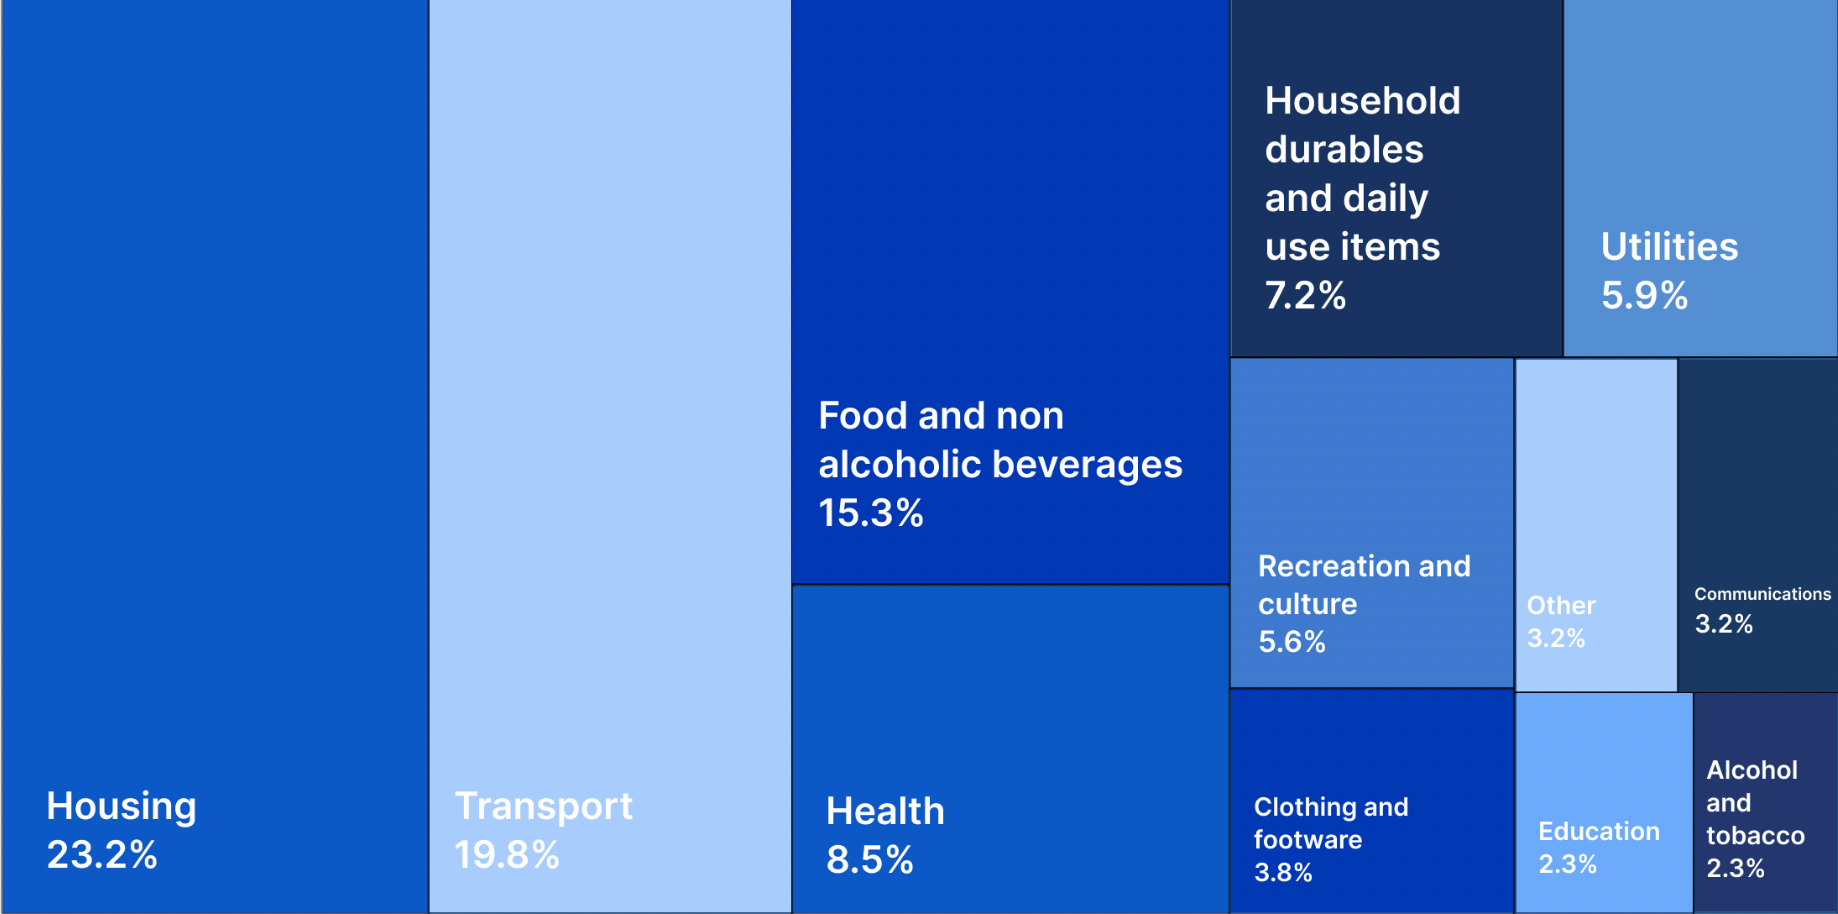
At Truflation, our categories and their weighting differ from the CPI. Prices at the pump for us are part of Transportation; gasoline is part of the energy for the BLS. Gasoline prices peaked in mid-June (at 8.86% YoY) at Truflation and have been coming down ever since. As of 21st July, Gasoline prices have decreased by 11.44% over the last month in our index. The BLS still has them going up by 11.2% a month from May to June 2022! The benchmark price of Crude Oil has come down about 20% since mid-June as well due to recession fears and the expectation of reduced demand as a result.

However, IF prices are moderating, and at Truflation, we are not saying they are yet! This will also make it harder for governments to incentivize increased investment in new production capacity for carbon-based fuels such as oil and natural gas. The net-zero transition makes long-term investment in new fields counter-intuitive for energy companies globally, especially if future expectations are of lower demand and lower prices for energy commodities due to a global slowdown in growth.
Housing mixed signals
For housing (Truflation’s category), we have seen house and rent prices remain consistently high for 2022; however, since June, our housing index has decreased by 0.76%. Is this due to market expectations that further larger rate rises now need to be priced in? Or is the housing market starting to cool as mortgage rates rein in excessive demand and make mortgages much more unaffordable for consumers? We will have to wait and see.
For BLS Shelter, their category for housing and rent costs, was up 5.6% YoY and 0.6% from May to June 2022. We can’t make sense of their numbers either; all our data shows that rent and housing costs have increased hugely across the past year and the rate of increase is only now starting to soften with the Fed’s most recent rate hike at the end of June.
Why do contradictions matter?
Because governments, central banks, and businesses need better data to make better decisions, especially when policy decisions are based on the economy's health and price pressures. Our data contradicts the BLS because it is based on a daily data collected from 30 different price data sources which makes it much more sensitive to price trends and changes. We built Truflation to measure inflation better, in real-time, to create an accurate daily picture based on our weighted annually updated basket of consumer goods.
Written by CeAnn Simpson
About Truflation
At Truflation, we believe in data and methodology, not sentiment and surveys. Check our Truflation Dashboard. We created Truflation based on real market price data collected from 30 different data sources daily to deliver crucial business intelligence around inflation. We provide a daily, unbiased, data-driven, real-market US inflation rate and other on-chain economic metrics to DeFi products and Web3 applications.
Our mission is to offer the most objective, decentralized, and current economic and financial information alternative in the form of on-chain price indexes to enable a new generation of blockchain products. We help developers create tools that help people maintain their purchasing power, navigate their portfolios through a challenging macroeconomic landscape, and propel the DeFi space into the new era of an inflation-proof and blockchain-powered economy.
Get Exclusive Insights
with our Weekly Newsletter