ONS CPI vs CPIH: Let’s break it down
Published 04 Aug, 2022
Truflation’s quest for global inflation data moved closer to reality last week with our UK inflation index launch. We turned our sights on the Office of National Statistics (ONS) and its two consumer price indexes: CPI & CPIH. Yes, the ONS has not one but TWO inflation indexes which measure CPI!
Let’s break down what the ONS includes in their two indices, how CPI/CPIH differ and how their weighting compares to our Truflation categories.
ONS: CPI vs CPIH
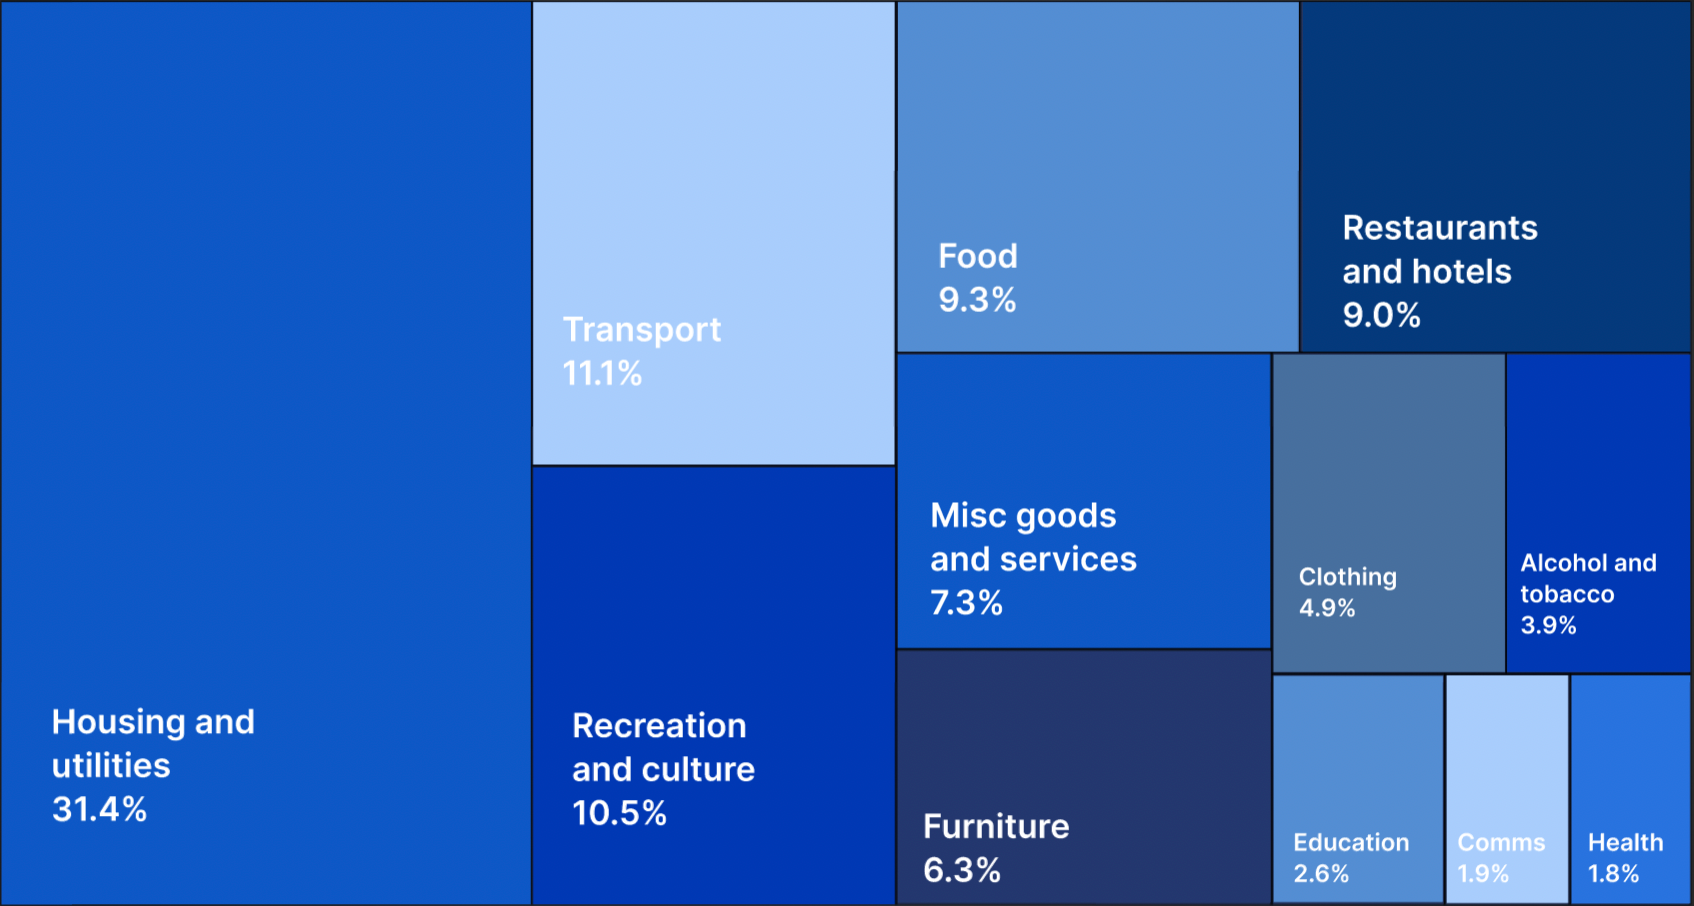
Like the US, the UK’s ONS CPI monthly bulletin is the headline inflation number you see quoted in the UK and global news as the inflation rate for the UK. Their report is released monthly and gives monthly % changes in inflation and also the YoY% changes. Although the ONS is independent of the UK government, its data collection and methodologies are decades old and outdated. For example, the often quoted CPI rate of inflation does not include housing costs. The ONS’ CPI index has 12 categories: housing & utilities, food and non-alcoholic beverages, alcohol and tobacco, clothing & footwear, furniture & household goods, health, transport, communication, recreation & culture, education, restaurants & hotels, and miscellaneous goods and services.
The ONS’ CPIH includes the same categories listed for CPI but adds owner/occupiers’ housing costs or OOH. OOH includes payments such as council tax, rental equivalence (uses the rent paid for an equivalent house as an estimate of the cost of housing services) and net acquisitions (the method for measuring OOH costs that are associated with the purchase and ongoing ownership of dwellings for own use including land values).

As you can see from the weighting above, CPIH captures a better basket of consumer goods because it includes housing costs and utilities, the largest expenditures for families. In addition, the OOH makes the CPIH more comparable to the US CPI and the Truflation CPIs. While exclusion makes the UK CPI more comparable to the harmonized EU CPI (HICP).
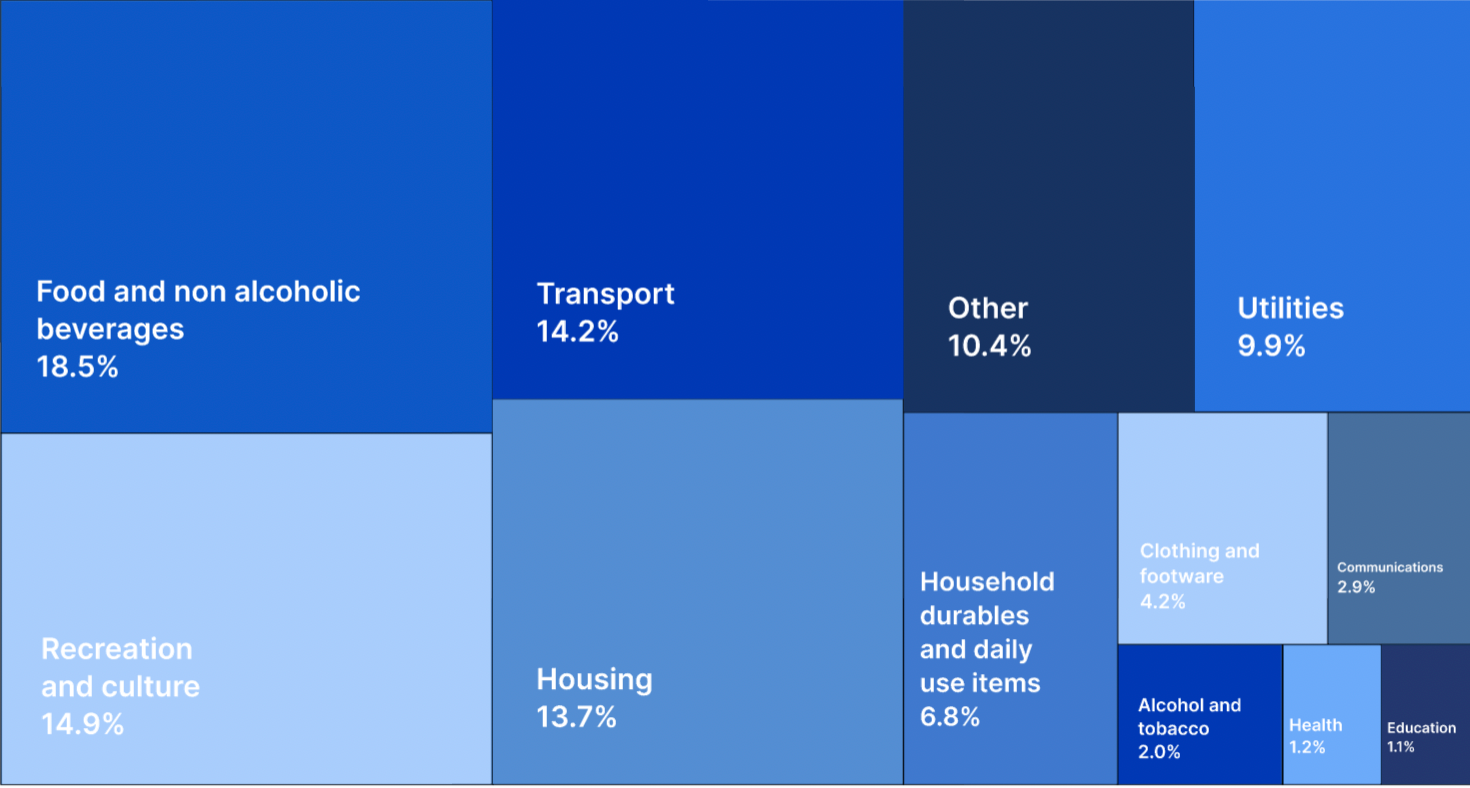
At Truflation, if we compare it to our UK inflation index, the CPIH would be closest to what’s in our basket. For the UK, we have used our methodology for creating our category weightings illustrated below:

Truflation’s UK Inflation dashboard shows indices for 12 main categories of products and services: Food & Non-alcoholic beverages, Housing, Utilities, Transportation, Health, Education, Clothing & Footwear, Communications, Household durables, Alcohol and Tobacco, Recreation & Culture, and Other. However, unlike the CPIH, we separate housing costs into housing and utilities to get a clearer picture of energy prices. Transport includes all motor fuels as well as new and used cars.
Launching in the UK market, we are one step closer to achieving our goal to help individuals, investors, companies, and institutions make more informed decisions by having access to independent and unbiased economic information across countries and industries.
Written by CeAnn Simpson
About Truflation
Truflation is an economic data aggregator serving independent, unbiased, real-time data on-chain and off-chain. Truflation’s goal is to help individuals, investors, companies, and institutions make more informed decisions by having access to independent and unbiased economic information.
Get Exclusive Insights
with our Weekly Newsletter