Truflation Public Peek: U.S. Monthly Inflation – August 2025
Published 10 Sep, 2025
The following is a public peek at our exclusive 13-page in-depth monthly Truflation CPI update, available by subscription, here.
Executive Summary
The US economy grew at a faster pace than initially estimated in the second quarter of the year, with GDP revised up to 3.3% from the preliminary 3.0%. This upward revision was primarily driven by a decline in imports (which subtract from GDP calculations), an increase in business investment in intellectual property (notable artificial intelligence) and a marginal rise in consumer spending, likely reflecting higher prices rather than increased consumption volume.
However this growth raises the question about sustainability. The reduction in imports, partly a consequence of tariffs, may distort the true picture of economic health. As the effects of import duties become more entrenched, their negative impact could become more apparent in the quarters ahead.
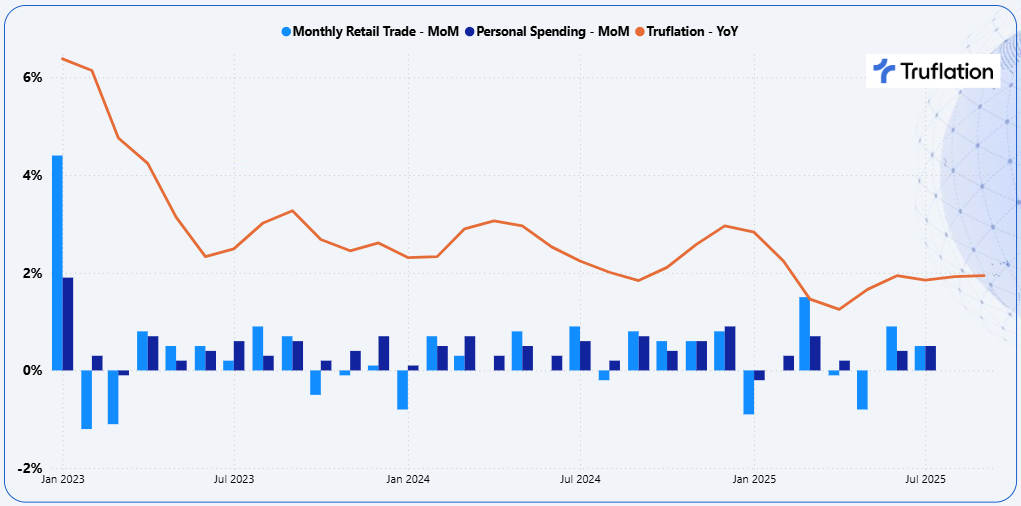
Retail sales in July rose by a solid 0.5%, following a 0.9% increase in June. Growth was supported by strong demand for motor vehicles and promotional activity by major retailers such as Amazon.com and Walmart. However a softening labor market and rising goods prices may pose headwinds to consumer spending in the third quarter.
Exhibit 1 – Monthly Retail Sales & Consumer Spending growth (MoM) compared to Truflation (YoY)

The strength in retail sales and the latest Q3 GDP Nowcast of 3.0% have temporarily eased concerns over a potential stall in economic activity, especially in light of weak employment growth over the past four months. Yet, consumer behavior suggests caution: spending on discretionary items such as dining out and hotel stays has declined, even during peak summer months. This pattern points to households adjusting their budgets under growing financial pressure. A persistently moderating labor market is likely to make consumers more selective in their spending decisions.
Businesses, meanwhile, have been drawing down inventories accumulated prior to the implementation of tariffs, which are now affecting cost structures. While some firms have absorbed these costs, many are beginning to pass them on to consumers. According to the Richmond Fed Survey, 45% of companies have already raised prices and expect to do so again, while an additional 24% plan to increase prices in the near future. In addition to this, 25% of businesses expect to begin raising prices in September. Among those who have already implemented price increases, 25% plan to raise again in August with another 25% expecting to do so in September. This highlights the continued pass through of cost pressures particularly from tariffs and supply chain adjustments to consumers. The staggered nature of these pricing plans suggest inflationary momentum may persist into the coming months, adding complexity for the Federal Reserve policy decisions.
---
[Excerpt ends mid-Page 2]
[Pages 2–7 omitted]
[Excerpt resumes mid-Page 7]
---
Recent inflation trends
Truflation projects that the Bureau of Labor Statistics (BLS) Consumer Price Index (CPI) for August will show a year-over-year increase of 2.8%, up from 2.7% in July. This forecast is broadly in line with market expectations, which currently range between 2.7% and 2.9%, suggesting a mild upward pressure on inflation.
The primary driver of this acceleration continues to be the prices of goods, which have shown renewed strength. In addition, the typically volatile categories of food and energy have seen noticeable price increases, contributing to the overall rise in headline inflation.
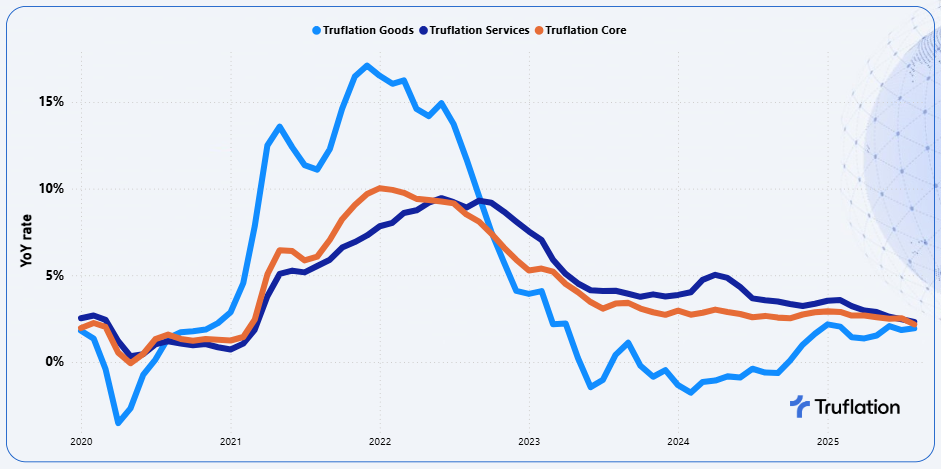
In contrast, core inflation, which excludes food and energy, has experienced a slight decline, largely attributed to housing-related components, as high interest rates continue to weigh on affordability and suppress demand. Services inflation has begun to decelerate, though it remains significantly higher than goods inflation, reflecting the ongoing resilience in labor-intensive sectors which in the recent months has experienced a softening.
Exhibit 9 – Truflation key inflationary metrics: Goods vs Services vs Core Inflation

The services sector activity has picked up in August and is the third consecutive month in which it grew but employment concerns remain subdued as the labor market conditions continue to ease. The Institute for Supply Management said its Services purchasing managers index increased to 52.0 from 50.1 in July. The prices index registered a 0.7% decrease from July release. This level of growth showed greater consistent strength, which was evident across 12 sectors.
Manufacturing on the other hand contracted for the 6th straight month in August, with suppliers taking the longest time in nearly three years to deliver input amid tariffs. Prices remained in the increasing territory as a result of the import duties and it being difficult for businesses to plan ahead.
At Truflation we are continuing to see inflation continue a steady increase which we believe will increase further in the coming months.
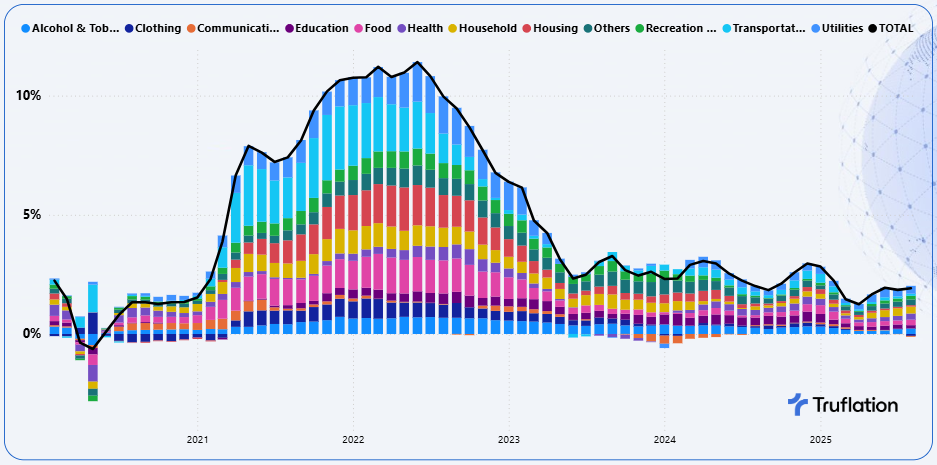
Exhibit 10 – Truflation Category Inflation Drivers

With the inflation marginally increasing and with the risks to the upside accelerating, the most significant upward contributing categories to inflation in August were coming from food, utilities, health and household durables with housing, transportation and communications being the biggest downward contributors.
Sector-Specific Inflation Drivers
---
[Excerpt ends mid-Page 9]
[Pages 9–13 omitted; report ends on Page 13]
---
The above is a public peek summary at our 13-page exclusive monthly Truflation CPI update, available by subscription, here.
Truflation Website | TRUF.Network | X | Linkedin | Discord | Telegram | Github| YouTube
Get Exclusive Insights
with our Weekly Newsletter