Truflation: US Inflation Update April 2024
Published 13 May, 2024
Executive Summary
The current economic situation is confusing, to say the least, with some data pointing to an incoming recession while other economic indicators suggest a strong economy with no signs of slowing down.
Inflation remains the single biggest concern on consumers’ minds, especially as price increases continue to impact shoppers. As such, it is not surprising to see the one-year forward inflation expectations increasing to 3.2%. This outlook, in turn, has a tendency to lead to behaviors that cause inflation to rise. Not a great sign of things to come if this turns into reality.
On the flip side, the jobs market remains strong with unemployment under 4%. In addition, while the economy grew slower than expected in Q1, consumer spending remains robust, up 5.1% in Q1 compared to a year ago, which bodes well for momentum going into Q2. Given this stickier inflation and the relatively unaffected employment market, the Fed is in a position to remain patient in its battle against inflation, with little urgency required.
Since the pandemic era supply-chain snarls have been resolved, the goods sector has helped to bring overall inflation lower as prices have slowed, and in some cases even fallen. But with the resurgence in inflation over the last couple of months, these supply constraints are re-emerging and causing pressure on the prices of goods. On top of this, the labor market continues to drive stubborn services inflation higher. So we seem to be losing the disinflationary impulse from goods while still waiting to see more progress on services inflation.
The indications are that prices remained elevated in April. When the Bureau of Labor Statistics (BLS) reports its figures on Wednesday, May 15, the markets are predicting the CPI-U to come in between 3.2% and 3.6%, while Truflation is expecting the CPI to come in at 3.5%.
The key highlights from Truflation’s April Inflation Report are:
- Inflation has recorded upward movement for the third month in a row, which highlights that the last mile in taming inflation will prove difficult.
- Wages are one of the primary inputs into services and with these remaining elevated, we are unlikely to see dramatic changes in services inflation any time soon.
- Supply-chain pressures are re-emerging due to ongoing turmoil in the Red Sea, the Panama Canal drought, and the collapse of a key bridge that blocks the port of Baltimore. These are affecting food prices and gas prices at the pump.
- Housing continues to apply upward pressure to inflation, in part due to the supply constraints, but also due to strong demand to purchase regardless of high mortgage rates in the assumption that prices will increase further when interest rates drop.
All this data highlights that the path to lower inflation remains extremely bumpy and progress will be slow. This will be a drag on American hard-earned finances and, as a result, any loosening of monetary policy is unlikely to happen anytime soon.
Recent inflation trends
The last mile of inflation will test the Federal Reserve to the limit. Slower disinflation and approaching elections are potentially a dangerous combination.
The Fed's task is harder than it looks on the surface. Its goal is to restrain demand enough to push inflation gently back to its 2% target without tipping the economy into a recession. This has been working well up until the last couple of months, but progress has stalled lately and recent data suggests it will take longer than expected to bring inflation under the 2% target.
The year-over-year (YoY) inflation, as reported by the BLS, rose to 3.2% in February and again to 3.5% in March. In addition, the closely watched core prices, which exclude volatile food and energy, have increased for three months in a row.
Meanwhile, several key economic indicators point to the ongoing strength of the US consumer. In March, retail sales surged 0.7%, suggesting that, with jobs remaining plentiful, consumers are largely unfazed by higher prices. This growth in sales came in much hotter than expected, underscoring the resilience of shoppers. In fact, March's retail sales increase was almost double what was expected, following another 0.7% rise in February. Even taking out gas prices, which have been on the rise, retail sales still rose by a solid 0.6%.
Disposable Personal Income increased 0.5% in March after a 0.3% gain in February. This was also boosted by the continued strength in the labor market and fueled personal spending growth to 0.8% MoM in March on top of a 0.7% rise in February.
However, consumers have been saving less and seem to be tapping into their savings: the savings rate fell to a 16-month low of 3.2% in March from 3.6% in February. Perhaps the low savings rate reflects their strong balance sheets, with low debt-to-income ratios driven by baby boomers and by household net worths rising alongside equity price increases and elevated house prices.
Chart 1 – US Personal Consumption
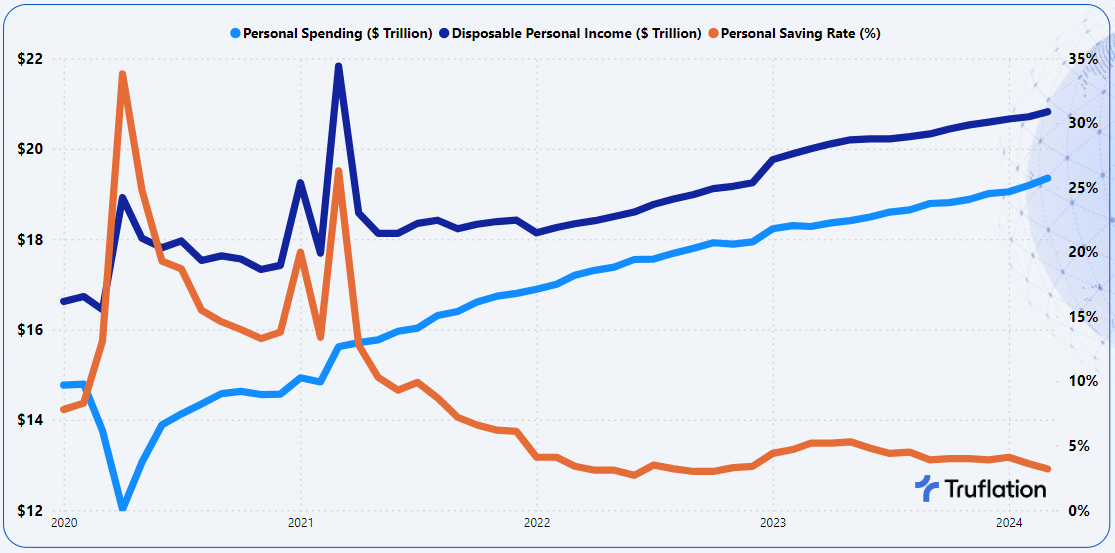
Source: Bureau of Economic Analysis, Personal Income and Outlay Report
This surge in spending, combined with the expectation of strong household balance sheets, helps explain the continued increase in household debt despite high interest rates. This is also supported by the rise in the share of mortgage-free homes in the US from 34.3% to 39.3% over the past decade. This means that 33.9 million homeowners are now mortgage-free and have more disposable income to spend.
While the jobs market has remained incredibly strong, it is showing some signs of cooling. The unemployment rate rose from 3.8% in March to 3.9% in April amid an increasing labor supply. Nonetheless, this marks the 27th straight month that the jobless rate has remained below 4%. Nonfarm payroll increased by 175,000 last month, the lowest in six months.
In addition, wages continue to show positive growth at 3.9% in April, still outstripping inflation. As the labor market remains tight, it could continue to put upward pressure on prices and is likely a key reason why people keep spending.
Despite the ongoing spending boom, though, consumer confidence dropped in April due to less positive views of future business conditions, jobs and income. Truflation’s Consumer Sentiment Index recorded a weakening in confidence from 93.21 to 90.44, but this level is still higher than this time last year. It is not surprising to see price concerns remain top of mind, especially food and gas prices.
However, with the jobs market remaining tight and spending patterns showing no signs of decelerating, the cost of services is likely to remain stubborn for quite some time, making this the key challenge in the Fed's last mile to bring inflation down.
Chart 2 – Truflation Core Inflation Measures (Core, Goods vs Services)

On a more positive note, core inflation has seen a marginal drop, with the rate of price increases slowing from 2.5% YoY in March to 2.4% YoY in April. This continues to be driven by non-core prices, while food and energy costs are still rising.
Overall, 66% of the category contributions are experiencing upward price movements (driven by the major categories of housing, transportation and food) compared to only 34% of categories applying downward pressure on inflation. This growth is not only driven by the services element but also by goods inflation, which increased 0.8% MoM in April.
April's most significant upward contributions to inflation came from petrol, owned housing and food. Meanwhile, vehicle purchases, cellular phone services and electricity were once again the biggest downward contributors.
Chart 3: Category Percentage Contributions to Truflation CPI

Categories applying continued upward pressure on inflation
In April, most of the upward pressure on inflation continued to come from petrol, owned housing and food due to supply constraints and ongoing demand growth.
Petrol prices continued their rise and were the single biggest contributor to inflation on the upside once again, with another significant increase of 5.1% MoM in April. This, as expected, was driven by the ongoing increases in crude oil prices since the middle of December. However, the early days of May brought some much-needed cooling, with prices reaching $78.17 per barrel on May 8, 2024. Compounding on top of the 6.4% MoM increase recorded in March, this has pushed the annual inflation in this category to a positive 0.7% YoY in April.
The national average price for regular gas on May 7, 2024, was $3.64 per gallon, as per data from the AAA. This marks a 2.8% increase from this day a year ago.
Chart 4: Price of WTI Crude Oil per Barrel
US$78.17 for May 8, 2024

Data Source: Weekly Petroleum Status from the Energy Information Administration
Crude oil futures have been relatively stable in the last couple of days as the US moves to replenish its strategic petroleum reserve, while a potential ceasefire in Gaza remains uncertain. The oil market has grown tighter, with global inventories declining by 300,000 barrels per day so far this year as OPEC+ countries have largely adhered to production cuts, according to a report from the Energy Information Administration.
There are still significant uncertainties surrounding the developments in the Middle East and a truce to this seven-month war appears elusive. It is unclear whether a ceasefire would halt Houthi militant attacks on shipping in the Red Sea, which is currently the most material risk for oil. It would take a bold investor to bet on this.
Similar to oil prices, housing remains another significant upward inflation driver. Truflation's housing index recorded a 0.8% MoM rise in April, which marks the fourth straight month of increases. Annual inflation in this category has risen further from 3.5% in March to 3.8% in April.
However, this category continues to see mixed results. The prices of rented lodgings have cooled, with only a 0.1% MoM increase in April, while other lodgings prices remained flat on a monthly basis.
Yet owned housing prices continue to rise. This category, which contributes 13.8% to total household expenditure, recorded increases of 0.8% MoM and 5.3% YoY in April. While we saw some cooling of inflation in this category previously, the annual growth rate has been hovering above 5% for the last four months and is now beginning to accelerate again.
In response to the Fed’s more cautious approach to monetary policy in its attempt to deal with sticky inflation, which has likely pushed out the possibility of imminent rate cuts, national average 30-year mortgage rates have been experiencing a steady increase (according to Freddie Mac). We have seen these rise from 6.79% on March 28 to 7.22% on May 2.
While the speculation around the timing of the first Fed interest rate cut continues, the CME FedWatch tool suggests the majority of the market is expecting to see the first cuts in September. Against this economic backdrop, it is difficult to see mortgage rates posting a meaningful and sustained pullback from current levels.
The most recent figures reveal that new residential home sales grew by 8.2% YoY in March, with a similar level of monthly growth at 8.8% MoM. In contrast, existing home sales, which account for roughly 80% of the total number, registered a downturn of 4.3% MoM, according to the National Association of Realtors (NAR). In addition, the median price of existing home sales stood at US$393,500, which marks an increase of US$9,000 since the previous month.
At the end of March, the number of unsold existing homes increased 4.7% MoM to 1.11 million, or the equivalent of 3.2 months’ supply at the current monthly sales pace. This is marginally higher than the 3-month supply in February, but remains a key concern since inventory must reach 4-6 months of supply to ease the rise in housing prices.
Clearly, many sellers are trying to take advantage of rising prices by listing their homes. New listings are up 15% - the biggest increase in nearly three years, while the total number of homes for sale is up 6% - the largest increase in around one year.
This increased supply is bringing back some demand, which is the main reason why price growth remains robust. Mortgage applications have increased 14% from a month ago. It appears that the high mortgage rates are not deterring buyers as much as they were last year, perhaps because some consumers are rushing to make a purchase ahead of even bigger price increases when interest rates finally do come down.
There are also nearly 6 million more jobs now compared to pre-Covid highs, which would suggest there are now more aspiring home buyers in the market.
The final key upward driver of inflation in March was food, which rose 0.7% MoM and 2% YoY in April. Food at home experienced price growth of 0.4% MoM and 1% YoY in April, marking the third monthly increase in a row. Supply-chain disruptions, increased tariffs on imported foods, and higher labor costs continue to play a factor.
Customers shopping at grocery stores are continuously looking for the best deals and shopping at multiple stores to extract the best value. As consumers continue feeling the pain, families are meticulously planning out their meals to maximize the money spent while mixing up the types of food they consume.
However, the major driver of food price increases was food away from home. Prices here have accelerated continuously over the past four months, up 1.2% MoM and 4.1% YoY in April. A significant underlying factor here are the rising labor costs because of the way higher wages and benefits tend to ripple through the entire supply chain. These costs are currently increasing faster than inflation – though they are beginning to slow down.
Amid these continuous price increases, McDonald’s, Olive Garden, Yum! Brands and Starbucks all report that consumers are tightening their budgets, resulting in a slowdown in sales for the first time in a long while. Food retailers are attributing this behavior to the strain of inflation.
Yet overall, spending on eating out is continuing to climb in the US. Restaurant spending was up 6.6% over the last three months compared to a year ago. Indeed, restaurant prices have increased much faster than grocery prices in the past year. The numbers suggest that people are eating out more, often opting to go out for dinner or lunch rather than cook at home.
Obviously, every family is different with varying budgets, but overall out-of-home dining has been on the rise. For example, a recent survey from OpenTable found that 60% of families plan to spend more on Mother's Day meals than they did last year. It is expected to be the busiest eating-out day of the year so far.
Categories applying downward pressure on prices
In April, the remaining categories exerted downward pressure on prices, with vehicle purchases, communication and electricity being the biggest drivers on the downside.
Despite the transportation category as a whole recording significant growth of 0.6% MoM and 2.2% YoY in April, it was a mixed bag. Within this, petrol and public transportation registered significant increases, while other vehicle expenses and vehicle purchases (new and used) applied downward pricing pressure. Vehicle purchases (new and used) account for 9.1% of household expenditure and recorded a -0.2% MoM and -5.8% YoY decline in April, respectively.
New vehicle sales rose 5.1% in Q1, as buyers chose to stay in the market despite high interest rates. But electric vehicle sales growth slowed, with mainstream buyers wary of their limited driving ranges and a lack of charging stations.
With dealer inventory growing closer to pre-pandemic levels, auto companies have been forced to reduce prices. The average sale price of new cars was down 3.6% in April from a year ago, marking the largest recorded monthly decline.
Chart 5: Motor Vehicle and Parts Dealers in $ Millions: Adjusted Sales and Inventories

Source: US Census Department: Advance Monthly Retail Trade Survey
Electric vehicle sales grew only 3.3% in Q1 - far below the 47% record sales growth last year. This can be explained by the fact that nearly all of the early adopters concerned about the impact of internal combustion engines on the planet have already bought electric vehicles. Now automakers are facing more sceptical mainstream buyers. This is where the headwinds come in, with concerns around the longevity of batteries or the infrastructure set-up.
With interest rates at a nearly 24-year high, the industry might have hit its spring sales peak already. Given the expectations of interest rate cuts later in the year, many consumers have no urgency to buy a vehicle right now and are taking a wait-and-see approach.
Communications is the second category experiencing deflation for the second month in a row, with price growth declining from -0.02% MoM in March to -0.14% MoM in April. Both residential phone services and the cellular phone category experienced a decline. Prices are being driven lower as competition between providers heats up, while consumers are looking to get more for less.
The other main category that exerted downward pressure on inflation in April was utilities, which remained flat compared to the previous month and recorded a 2.45% YoY growth. The major contributors to this category are natural gas, down -0.93% MoM, and electricity, up 0.27% MoM.
This has been driven by various factors, including the prices of commodities like natural gas and heating oil coming down, increased supply, and the arrival of the spring season, when demand for electricity tends to ease compared to the winter months.
Beyond this, in the coming months, consumers can expect to receive rebates tied to home energy efficiency under the Inflation Reduction Act. These federal rebates, worth up to $14,000 or more per household, are discounts aimed at partially or fully offsetting efficiency upgrades for homeowners. The program is designed to save households $1 billion a year in energy costs by improving efficiency. This will no doubt impact utilities prices in the future as the program rolls out, while at the same time benefiting the environment.
A few silver linings, but a long road ahead
Inflation has been trending higher for three months in a row now. While it has come down significantly from a year ago, this resurgence is evidence that this last mile of inflation will prove difficult to tame.
Economists have long expected housing prices to bring inflation lower, which has so far failed to materialize. However, there is still hope on the services side. Wages are one of the primary inputs into services and these have been relatively stable and have even come down somewhat in recent months. They are expected to continue coming down, which will put a calming pressure on services over the long term.
The other factor that needs to be addressed are increasing supply constraints that are affecting food prices. While these are not skyrocketing like they have done in the past, we are seeing an acceleration once again. This, combined with the geo-political environment that is driving up prices at the gas pump and the rising prices of service-related businesses, is putting renewed pressure on consumers.
Overall, it is going to be a painfully slow process to bring inflation back to a place where consumers no longer have to think about it in their daily lives.
Since prices are not going to revert to where they were, the best we can hope for is a moderation in the rate of price increases. However, overall, consumers will still be bothered by the current price environment for some time.
The most recent consumer-based inflation expectation surveys from the University of Michigan, which represents the sentiment of American households, reveal that they expect inflation to average 3.2% in the next year. This not only marks an increase from the previous month, but is also the highest rate since November 2023 and points to less optimism that inflation will be tamed.
Chart 6: Consumer Inflation Expectations (2% is the Fed Target)

Source: University of Michigan
About Truflation
Truflation provides a set of independent inflation indexes drawing on 30+ data partners/sources and more than 14 million product prices across the US. These indexes are released daily, making it one of the most up-to-date and comprehensive inflation measurement tools in the world. Truflation has been leveraging this measurement tool to predict the BLS CPI number, with four predictions spot on and all but one deviating by no more than 20 basis points since coverage was initiated.
Website | X | Discord | Telegram | Github | YouTube
__
APPENDIX A
Truflation Category Percentage Change Data
Month-over-Month and Year-over-Year
All Data is based on April 2024
Truflation
Privacy Policy | © 2025. Truflation - All Rights Reserved.