Truflation: US Inflation Update December 2024
Published 14 Jan, 2025
Executive Summary
Inflation is now well below the 40-year highs of 2022, when the central bank kicked off its aggressive rate-hiking campaign that pushed interest rates to a 23-year high. Tamping down inflation in just over two years without triggering a recession despite warnings from critics stating so, has been well met but the consumers have been feeling the pain. Since the beginning of Quarter 2, when the Federal Reserve seemed to have tamed inflation, Truflation expected inflation to rise, and it did, from mid-September onwards and for December we are expecting no change in the trends.
There are a new set of economic challenges: looser business regulations and tax cuts that are expected to help propel growth in 2025, while the clamp down on immigration and the prospects of new tariffs will result in inflation continuing to rise and will no doubt complicate the Federal Reserve job with the biggest economy at risk.
Looking back on 2024, the last two quarters in particular grew on par with the long run average (1947 to 2024) with the Atlanta Federal Reserve GDPNow estimating the 4th Quarter to come in at 2.7% providing strong momentum into 2025. All this with employment growth every month this year. Consumer spending rose nicely up 5.3% over the last 12 months and almost everybody who wants a job has one with wages now rising faster than inflation. Consumer borrowing is still at an all time high, but households continue to feel optimistic given the employment situation.
Construction across all sectors has been relatively flat, with the surge in data centres and semi-conductor fabrication plants offsetting decline in residential and commercial buildings. Business capital spending has also dropped except for data center related purchases. Government spending continues to grow rapidly at federal, state, and local levels with some of the state and local gains coming from federal grants. Exports are roughly flat over the past year, though imports have increased. The strong dollar makes American made products more expensive for foreigners while imported goods look cheaper to American consumers and businesses. The rise in interest rates since 2021 certainly has brought construction down and maybe some business capital spending as well.
Rolling all of these factors together, the U.S. economy is heading into the new year with very good momentum overall, though some sectors don’t show much strength.
Recent inflation trends
Inflation has been one of the top concerns for the US Economy in 2024 and the concerns over sticky prices will continue in 2025. Despite the moderation in 2024, inflation remains stubbornly above the Federal Reserve target of 2% on an annualized basis. In November the core Personal Consumption expenditures Index (PCE) and the core Consumer Price Index (CPI) rose 2.8% and 3.3% respectively over the prior year.
Exhibit 1 – Core Inflation YoY Comparison: Truflation, PCE and CPI vs 2% Federal Reserve Target
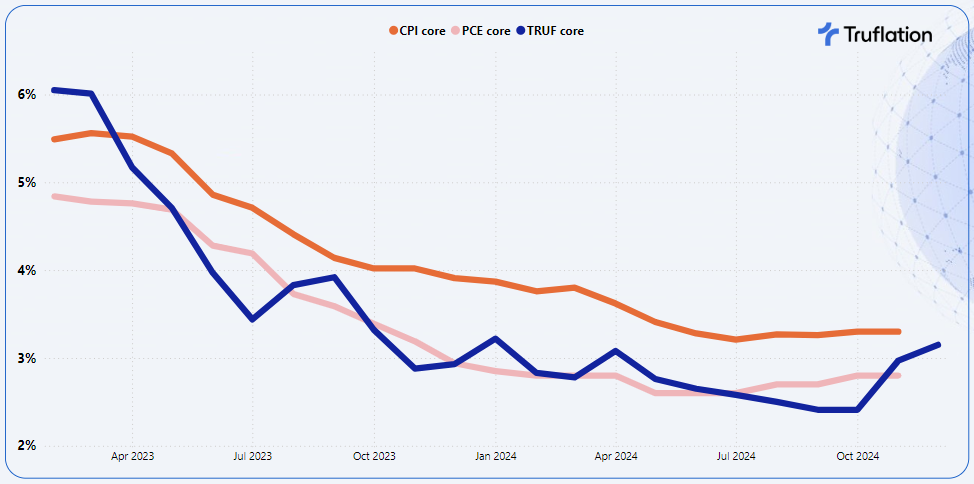
Inflation continues to be driven by the services side of the economy especially by healthcare, insurances and airfares. Housing is also still high and although it no doubt will come down in 2025, it is likely to remain elevated.
Bringing this closer to home, Truflation’s forecast for December CPI, is yet another increase to 2.9% YoY from November’s 2.7% and is a clear signal that inflationary pressures are not abating and instead are continuing to build. This projection aligns very closely with the broader market expectations, which ranges from 2.6% to 3.0%.
Core inflation continues to be the driving force here, it is critical because it tends to be a more reliable signal of broader, more persistent inflationary pressures. If core inflation keeps rising, the Fed might be less inclined to ease up on rate hikes or cuts, even if headline CPI moderates somewhat due to temporary declines in energy prices or other volatile components.
A secondary driver in inflation this month is the expected festive seasonal boost which has affected multiple categories, including food and beverages.
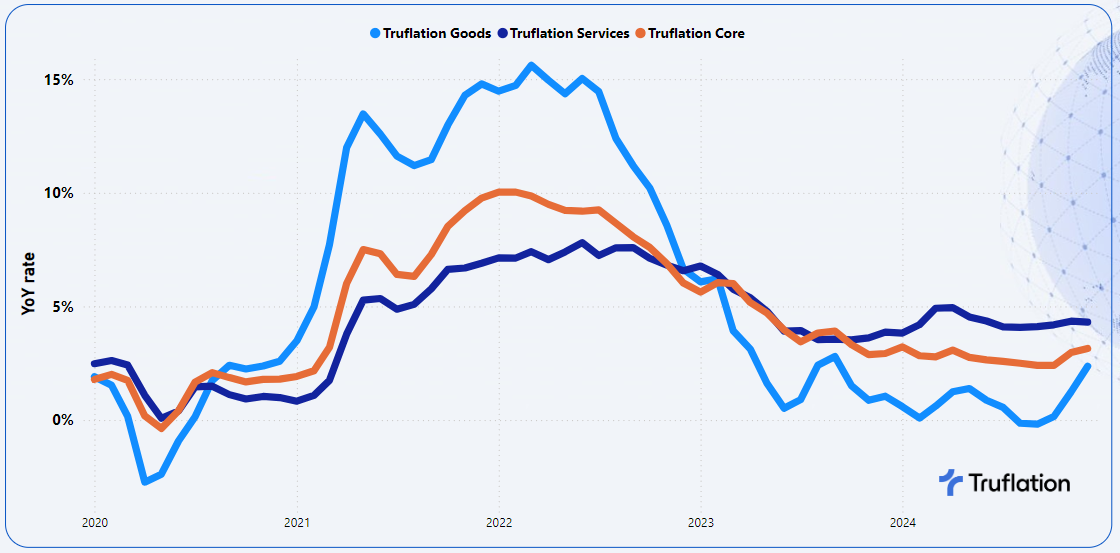
It is not a surprise to see Goods inflation being a key driver but is of course more volatile than services. Goods have been a persistent driver over the last couple of months and in part is due to the continued higher input costs but also demand accelerating during this time of the year.
Exhibit 2 – Truflation key inflationary metrics: Goods vs Services vs Core Inflation
Given the persistent inflation in the essential categories, it suggests that the Federal Reserve may need to tread cautiously in its policy decisions as we look ahead into 2025, at least until inflation shows more consistent signs of retreat, but also balancing the economic growth with the associated incoming administration policies that could have significant ramifications on the economy.
Exhibit 3 – Truflation key inflationary metrics: Goods vs Services vs Core Inflation
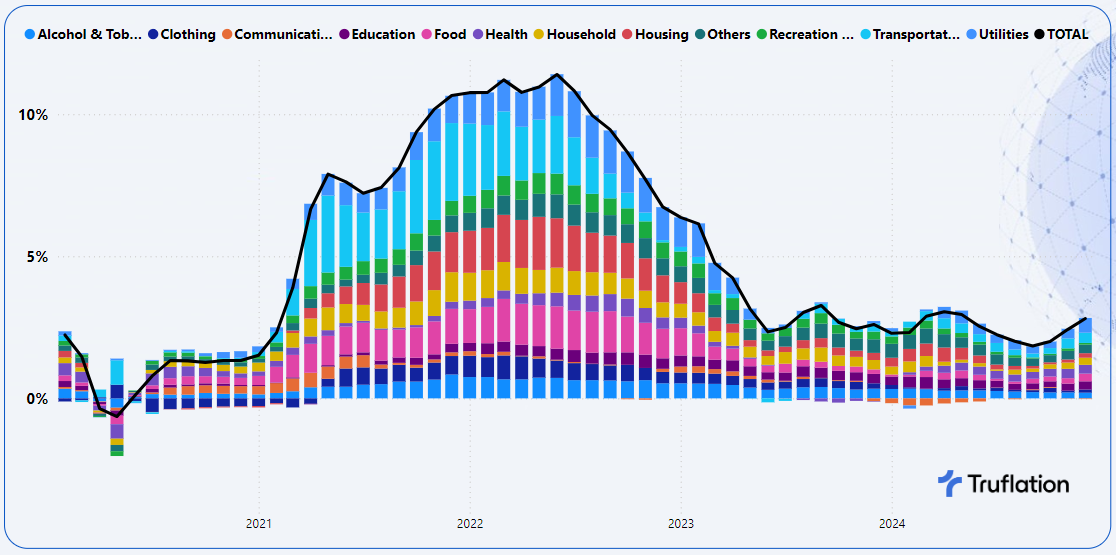
Despite the varied category performances in this festive season, no doubt will continue into January, inflation will continue to be influenced by two critical factors: the labor market and the economic policies of President-elect Trump.
Sector-Specific Inflation Analysis
- Food: Prices rose +1.2% MoM and +2.9% YoY, driven by the festive season and the premiumization of consumer purchases. According to Mastercard SpendingPulse which tracks all kinds of payments, highlighted up until Christmas Eve, spending increased by 3.8% which is up from 2.1% the previous year. Consumers continue to be willing to spend but are driven by a search for value. This accelerated festive spending was seen in both at home and dining out.
- Alcohol & Tobacco: Prices rose +0.7% MoM and +2.1% YoY is equally driven by the holiday season, when Americans on average tend to drink double their typical amount of alcohol. Couple this with the consumer purchasing more premium based products at this time of the year.
- Household Durables: Prices rose +0.4% MoM and +2.6% YoY which is driven by the holiday season combined with the significant price increases over time driven by increases in higher material costs, inventory challenges and premiumization.
- Transportation: Costs fell by -0.4% MoM but rose +3.9% YoY. There has been an overall decline in the transportation costs with the single biggest driver being gasoline prices which have come down another 1.7% in December. The one exception is public transportation costs including air travel which have seen a significant increase of +0.3% MoM.
- Housing: Overall housing prices declined by -0.2% MoM and +1.7% YoY. However the housing market shows mixed signals, with owned housing seeing a decline of -0.5% MoM and -2.2% YoY, while rented housing saw a marginal decline of -0.1% MoM and a growth of +0.5% YoY. Home sales have started to build momentum with more buyers entering the market as the economy continues to add jobs and wages accelerate. The Housing inventory has also grown +17.5% compared to a year ago and it seems that consumers are getting used to the new normal and elevated mortgage rates.
- Recreation & Culture: This sector experienced a notable reversal with a -0.2% MoM decline, and on an annualized basis increased +0.7% YoY. The main reason is that as consumers approached the holiday season knowing the increase in spend, they have been more selective and prioritizing their spend. A recent study by PwC highlighted that 34% of the consumers were cutting back on events and outings allowing them to indulge where it matters most to them.
Longer term views
As we turn to 2025, we at Truflation are expecting the economy to keep growing driven by the labor market which continues to represent the greatest limitation on economic growth in 2025. Consumer spending is expected to be adequate to keep the economy producing at its capacity but with the driving force on economic growth shifting we need to move away from looking at the growth from a Keynesian lens, ie how much spending will grow, to a supply-side lens with the question of how much can the U.S. economy produce.
The Federal Reserve had hoped to be at its target of two percent price increases, but that did not happen in 2024 and is quite likely that this will not be achieved in 2025. The problem is simply too many dollars chasing too few goods. With this in mind, we can expect to see further inflationary pressures ahead in the short term and some of those driving forces include:
- International Conflict poses significant risk to the economy and can certainly throw a spanner into the works as the Russia-Ukraine war did. China-Taiwan could certainly escalate and the Middle East remains a concern for disruption.
- Tariffs and retaliatory tariffs, albeit a likely one-time jump in the price level rather than provoking year-after-year increases, will drive inflation upwards. This will vary sector by sector, with some supply chains being more flexible, such as wheat, oil or copper can easily be sourced from different countries when tariffs push up the cost from one supplier. Custom-made products, on the other hand, present a severe problem. The outcome is the extent of the increase in inflation as a result of re-jigging supply chains and associated logistical and operational costs.
- Immigration based on the campaign messaging it is expected that President Trump will begin clamping down on border crossings immediately after his inauguration. This reduction in the size of the labor market will no doubt impact certain sectors of the economy more and will stifle economic growth, and could lead to production declines. It will also have the reverse effect of increasing the cost of businesses as wages will rise with a limited labor market.
- Energy will be critical for growth and given the electrical disruptions at present in part due to weather anomalies or random mechanical failures, continued investment in a consistent source of energy, investing in infrastructure and dealing with the complex challenge nationally.
- The employment market has been experiencing hiring rates normalizing, while unemployment has been edging up from 3.7% at the start of 2024 to 4.1%, which based on the historical average is low. With the continued growth in wages bolstering purchasing power it will no doubt support consumer confidence and as a result retail spending. However we do need to keep a cautious eye on debt balances and delinquencies.
- Artificial intelligence will have a positive impact on the economy and inflation as it will boost output per worker in a number of sectors, including healthcare, finance, manufacturing and information technology. That would lead to more inflation-adjusted GDP despite limited growth of the labor force. The question is whether the upside outweighs the downside.
Conclusion
In the short to medium term, we expect inflation to remain elevated, driven by the tight labor market which will continue to keep the prices of services high. In addition to this, the extent of the upward inflationary pressures will also be dependent on the new administration and the implementation of its campaign messaging.
Overall we are cautiously optimistic about the future with three major themes for 2025:
- The resilient consumers will continue to retain jobs, supporting their growing purchasing power which will support economic growth.
- The speed at which the Trump administration will implement the changes that it talked about on the campaign trail in particular immigration, de-regulation and tariffs.
- The US debt and how this will be managed if at all.
About Truflation
Truflation provides a set of independent inflation indexes drawing on 30+ data partners/sources and more than 14 million product prices across the US. These indexes are released daily, making it one of the most up-to-date and comprehensive inflation measurement tools in the world. Truflation has been leveraging this measurement tool to predict the BLS CPI number, with four predictions spot on and all but one deviating by no more than 20 basis points since coverage was initiated.
Appendix A
Truflation Category Percentage Change Data
Month-over-Month and Year-over-Year
All Data is based on December 2024
Truflation
Privacy Policy | © 2025. Truflation - All Rights Reserved.