Truflation US Inflation Update for April 2025
Published 12 May, 2025
Executive Summary
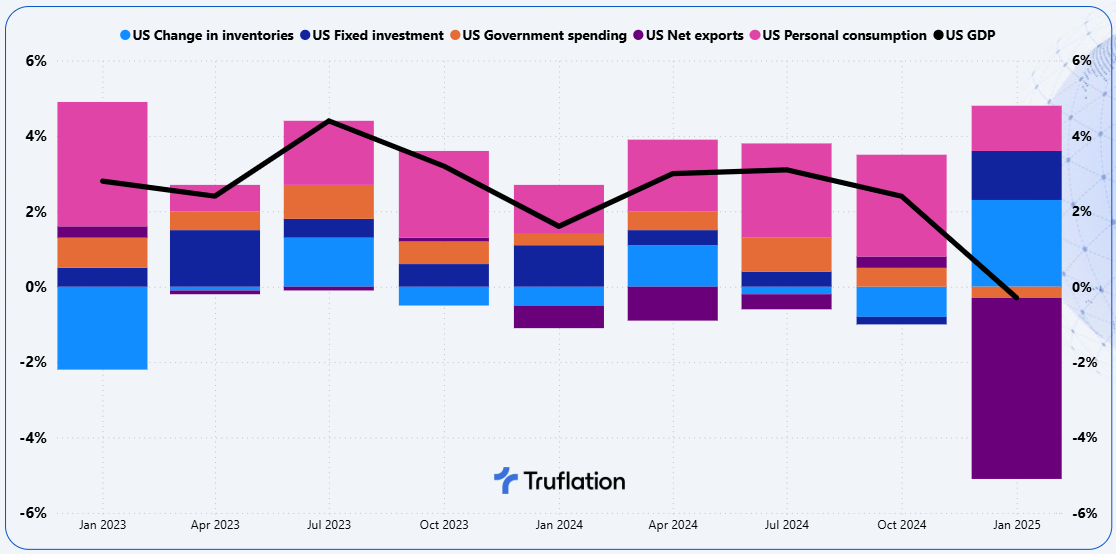
The US economy contracted at an annual rate of 0.3% in the first quarter of 2025, the first time in three years. This was primarily due to an astonishing 41% increase in imports (at an annualized rate) and is largely attributed to front loading in anticipation of tariffs. Assuming all else is equal, it is likely that the GDP growth will catch up as inventories are used up and the consumer continues to spend. However, given the dependency on overseas goods, this approach is only sustainable on a shorter horizon. Otherwise supply gaps will start to occur combined with increases in prices.
Exhibit 1 - US contributions to GDP growth, percentage points
The job market on the other hand continues to remain resilient with employers adding 177,000 roles in April, even with a 9,000 drop in government jobs. Nearly 55% of industries added workers, showing demand was pretty broad based. Average hours worked rose, reversing previous downtrend and the labor force participation rose as well. Unemployment remained stable at 4.2%.
However, the number of job openings is now below 7.2 million and is likely to continue to drop (pre pandemic levels averaged between 6 to 7 million). The ADP’s measure of private payroll rose by 62,000 only for April. The ISM manufacturing employment gauge is still contracting, and it seems that employers are repositioning themselves and prioritizing resilience, digital scale and operational efficiencies over raw headcount growth.
Tariffs remain a source of uncertainty, and if a rollback emerges then there is a high likelihood of avoiding a recession, otherwise a potential outcome is stagflation. Tariffs are beginning to make their impact across prices on multiple categories. This combined with a slowdown in Chinese imports which will likely translate into layoffs across retail, trucking, shipping and dockyards as a start.
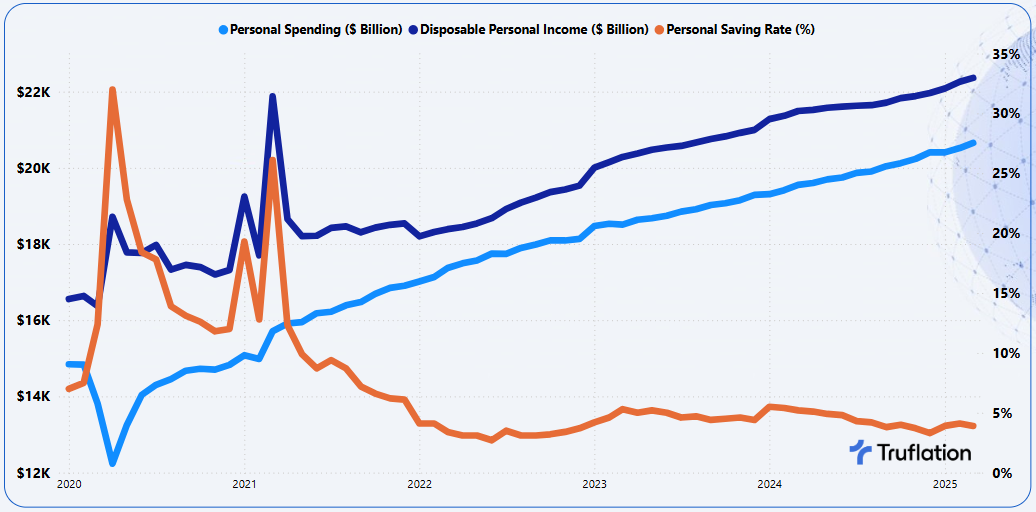
The other economic data is also conflicting; personal spending rose 2.3% on an annualized basis with the rate of growth falling from 2.7% growth. On the flip side retail sales increased 1.4% vs the previous month and is up 4.6% on an annualized basis. Are consumers front loading in anticipation for tariffs? Consumer confidence suggests otherwise, as it has plunged again in April for the fifth consecutive month, and falling to levels not seen since the onset of the pandemic.
Exhibit 2 - US Personal Consumption
The Federal Reserve keeping the interest rates unchanged was expected and it is likely that the Federal Reserve will keep the interest rates unchanged for several more months as it seeks to evaluate the impact of the widespread tariffs on hiring and inflation. The White House is urging the Fed to cut rates given that inflation is not far from the Fed’s 2% target. Even if the Fed cuts rates, it is assumed that borrowing costs will come down, but there is no guarantee.
The expectation from tariffs is that import taxes will lift prices but how much or for how long? Typically tariffs cause a one-time increase in prices but not ongoing, yet with tariffs threatened on pharmaceuticals, semiconductors, copper and most recently the film industry, or if the consumers worry that inflation will get worse, that could send prices higher in a more persistent way.
Navigating this tricky path will remain challenging and the Fed faces an uncertain outlook due to the tariffs. For now, the US economy is mostly in good shape, and inflation has cooled considerably from its peak in 2022. Consumers continue to spend at a healthy pace, though some of that may reflect buying things like cards ahead of tariffs.
Recent inflation trends
Throughout the quarter earning seasons, a lot of companies have been sending out warning signals of higher prices given the impact of tariffs. Apple expects a $900 million increase in costs due to tariffs. GM and Ford are expecting increased costs of $4 billion and $2.5 billion respectively due to tariffs. This will be passed on to the consumer, but the question is how much can they offset with productivity gains.
Truflation is forecasting that the CPI reading for April will hold relatively steady, with an annualized increase of 2.3% YoY in April from March 2.4% YoY. This projection aligns very closely with the broader market expectations, which ranges from 2.2% to 2.6%.
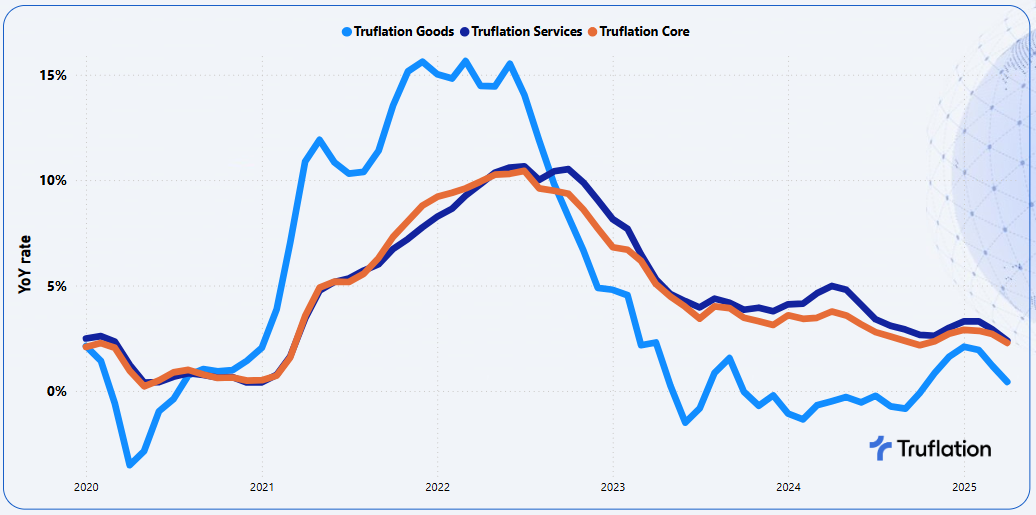
The non-core categories are the main driving force with a continued gradual moderation in the core categories which seem to have held up more significantly. The secondary driver of inflation this month is the prices of Goods which have seen a significant drop compared to Services as consumers take advantage of the price discounts / promotional activities as well as buying cheaper alternative products as the tariffs slowly start to make an impact.
Exhibit 3 – Truflation key inflationary metrics: Goods vs Services vs Core Inflation
Inflation is seeing a gradual return to “Inflation Normalization” rather than a price decrease as tariffs continue to play an impact. Even with the new deal agreed between the US and the UK we are still seeing significant tariff increases, just at a lower rate, e.g. UK cars are the biggest export to the US and are seeing 10% tariffs (up from 2.5%), but down from the initially proposed 27.5%. This will be applied to the first 100,000 cars being imported and thereafter tariffs will increase up to the proposed 27.5%. What happens with other industries, e.g. Pharmaceuticals, is still unknown combined with the remaining countries. If we see this trajectory continue, we will see inflation accelerating again.
With the uncertainty of whether the economy will continue its steady pace of growth, the challenge for the Federal Reserve is managing the risks of higher inflation and unemployment. The rush of front loading to buy goods and stock shelves won’t likely be repeated and it is unclear whether demand and investment will start to weaken and how this will express itself in hard data on inflation and jobs. The direction of the Fed will depend on which of the job and inflation risks develop or in the more difficult outcome, whether inflation and unemployment will increase together and force the Central Bank to choose which risk is more important to try to offset with monetary policy. The recent better than expected jobs data has supported the Fed decision to hold, and the onus is on the labor market to weaken sufficiently to bring a resumption of its easing cycle.
Exhibit 4 – Truflation Category Inflation Drivers
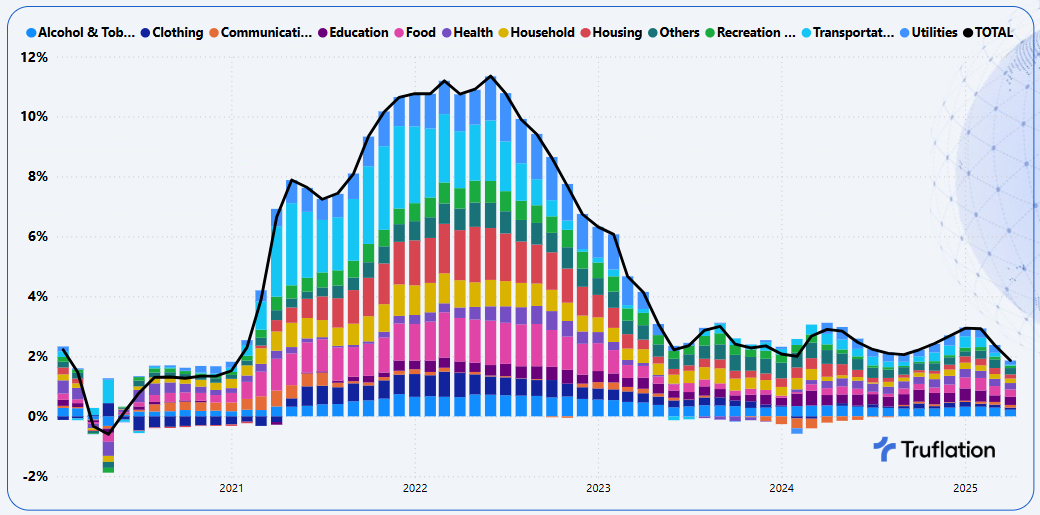
With inflation stabilizing, and the potential risks to the upside, the most significant downward contributing categories to inflation in April are coming from household durables, education and utilities while food, housing and transportation are the biggest upward contributors.
Sector-Specific Inflation Analysis
- Household Durables: Prices have come down -0.2% MoM and +2.1% YoY due to a combination of easing supply chain issues and a shift in consumer spending patterns. The demand for home furnishings, which surged during the pandemic, has cooled as consumers shift their spending towards services and as the housing market slows. Additionally, retailers are now cutting prices to clear excess inventory accumulated during the pandemic.
- Education: Despite having a 2.3% contribution to overall inflation, prices have declined -0.4% MoM and +3.9% YoY with the driver being education fees. The rate of increase of college fees has been declining due to institutional cost control and a shrinking pool of prospective students leading to greater competition among colleges.
- Utilities: Prices rose +0.1% MoM and +1.7% YoY as is evident across all sub-categories in particular electricity and natural gas which is likely driven by the change in weather conditions driving a change in usage of utilities in April as the temperature rises.
- Food: Prices increased again this month +0.3% MoM and +3.3% YoY. Supermarkets sell imported items in every section of the store and the 10% tariffs applied from all countries will result in some of the higher costs passed on to the consumer. Expect to see prices rise on seafood, coffee, fruit, nuts, candy, and other imported foods. Items that contain ingredients and packaging like plastic and aluminum from other countries will also be hit. Perishable food prices have risen first, followed by shelf stable goods. Shoppers will start to see this scale in the 90 days from tariff implementation.
- Housing: Overall housing prices rose another +0.4% MoM and +1.9% YoY. It continues to be the rented prices that have seen the largest increase with +0.6% MoM & +1.9% YoY. This is driven by the low inventory levels, barriers to homeownership, expired rent freezes and discounts and shifts in tenant demand, especially as more demand to live alone. The owned housing has seen a +0.2% MoM and +1.9% YoY. Home buying and selling remains sluggish due to the affordability challenges associated with high mortgages. Couple this with residential housing mobility currently at historic lows, signaling the troublesome possibility of less economic mobility for society.
- Transportation: Prices saw a notable increase of +0.2% MoM and +0.4% YoY but within the category, is a very mixed situation. Market tariffs are coming into play for new cars and some automakers have already shipped new vehicle shipments to America, banking on the Administration to reverse course before car supplies run out. Should that not happen expect average car prices to rise by about +10%. On the flip side, gas prices continue to decline, even though this is the time of the year when gas prices go up. Supply and demand are the main reasons for the dip. OPEC+ announced its increasing oil production next month by more than +400,000 barrels a day – much more than expected – the price of crude oil has been falling. Oversupply coupled with tepid gasoline demand is resulting in lower pump prices.
Longer term outlook
There are signs that inflation will worsen in the coming months. Surveys of both manufacturing and services firms show that they are seeing higher prices from their suppliers. It also found that nearly 55% of manufacturing firms expect to pass on the impact of increases to customers.
Yet the tariffs could also weigh heavily on the economy, because of the uncertainty they have created. The tariffs announced on about 60 counties on April 2nd, were then postponed until July 9th but could or could not be reimposed. The economics of uncertainty is suffocating as businesses don’t know the rules of the road. A business survey has shown that firms are postponing investment decisions until they have greater clarity.
In March, the Fed signaled that it could cut rates twice this year, but since then the tariffs imposed are larger and broader than the Fed expected. Powell signaled that if slower growth combined with higher prices i.e. the two goals that come into conflict, the Fed would put more weight on inflation concerns. “Without price stability, we can not achieve the long periods of strong labor market conditions that benefit all Americans” Powell said.
The current inflation expectation, which essentially is a measure of how much consumers are concerned that inflation will worsen, is not helped by the fears of higher prices from tariffs, and as a result has sent the consumer 12 month expectations skyrocketing to new levels not seen since the pandemic.
Exhibit 5 – Consumer Inflation Expectations (2% is the Fed Target)
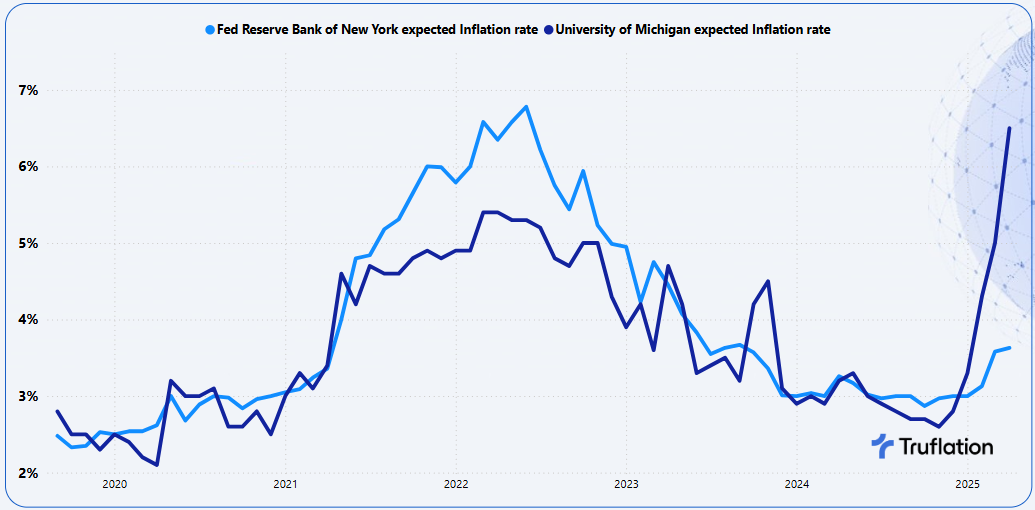
Higher inflation expectations can also be self fulfilling, as Americans think prices will rise and they can take steps that push up costs further, such as asking for higher wages. As for now wages have been cooling. You combine this with the overall employment market, we are likely to see more upward inflationary pressures on goods as well as services. This is a story about inflation as well as about economic growth.
Conclusion
In the short to medium term, we are going to have a couple of one-time adjustments to inflation with the question of how resilient the consumer remains supporting growth with increased indicators that should be at a minimum a note of caution.
APPENDIX A
Truflation Category Percentage Change Data
Month-over-Month and Year-over-Year
All Data is based on April 2025
About Truflation
Truflation provides a set of independent inflation indexes drawing on 30+ data partners/sources and more than 15 million product prices across the US. These indexes are released daily, making it one of the most up-to-date and comprehensive inflation measurement tools in the world. Truflation has been leveraging this measurement tool to predict the BLS CPI number, with a 99.94% accuracy in predicting inflation in the last 12 months.
Truflation Website | TRUF.Network | X | Linkedin | Discord | Telegram | Github| YouTube
Truflation
Privacy Policy | © 2025. Truflation - All Rights Reserved.