Truflation US Inflation Update for January 2025
Published 11 Feb, 2025
Executive Summary
It really has been a volatile beginning to the year with these tariff changes. The temporary pause for Mexico and Canada may offer some short-term relief, but the broader tension with China is likely to cause ripples throughout the global economy. With the additional 10% tariff on top of the 25% from the previous administration, China is clearly making a point of responding to the US’s moves, and can only complicate relations further. It is likely to affect the prices of everyday products for U.S. consumers, making things like electronics, clothing, and various household goods more expensive.
President Trump has shifted his position on interest rates, especially after previously advocating for immediate rate cuts. His agreement with the Federal Reserve’s decision to leave rates unchanged signals a potential recognition of the broader economic factors at play, and it could indicate a more measured approach moving forward.
The final GDP release of the last three months of 2024 highlighted that economy growth slowed a bit more than expected. The economy grew 2.3% annualized inflation adjusted, while economists were expecting an increase of 2.5% after a growth of 3.1% in the third quarter. It closes out 2024 on somewhat of a downbeat note, though growth held reasonably solid. The full year GDP accelerated 2.8%, compared to 2.9% in 2023.
Growth continued to be held up by the consumers who continued to spend briskly despite the ongoing burden of high prices on everything from homes to cars to eggs at the supermarket. While inflation is dramatically lower from mid 2022, it remains a burden for households particularly those on the lower end of the income scale. Consumer spending rose a strong 4.2%, and as usual, amounted to about 2/3 of all activity. Government spending also provided a boost, accelerating at a 3.2% level.
In other economic news, job growth slowed more than expected in January after robust gains in the prior two months. Health and Social Services were the biggest industries for job growth. The unemployment rate came in at 4.0%, which is not 100% directly comparable to December 4.1%, due to the new population controls. In addition to this we have seen strong wage growth with hourly earnings surging by the most in 5 months, which will no doubt keep consumer spending supported.
The resilience of the economy and the relative lower inflation has allowed the Federal Reserve to assume a more patient stance on monetary policy. At the most recent Fed meeting, central bankers gave no indication that they are expecting cuts anytime soon, with Chair Jerome Powell insisting that he is in no hurry to ease. There are concerns that inflation has returned and the most recent PCE Price Index, increased 2.2% in the quarter, faster than the 1.9% move in the third quarter.
However, the data also showed that consumers are dipping into savings to fund their purchases. The personal saving rate was 4.1%, down 0.2 percentage point from the prior quarter, for the lowest level in two years.
Recent inflation trends
Inflation remains one of the top concerns for the US Economy especially as the sticky prices are likely to continue in 2025. This rise in inflation in December including core inflation is no surprise given the festive season (witnessed across Personal Consumption Expenditures Index (PCE) and Consumer Price Index (CPI), and most reliably Truflation, which have marginally declined over the prior year.
Exhibit 1 – Core Inflation YoY Comparison: Truflation, PCE and CPI vs 2% Federal Reserve Target
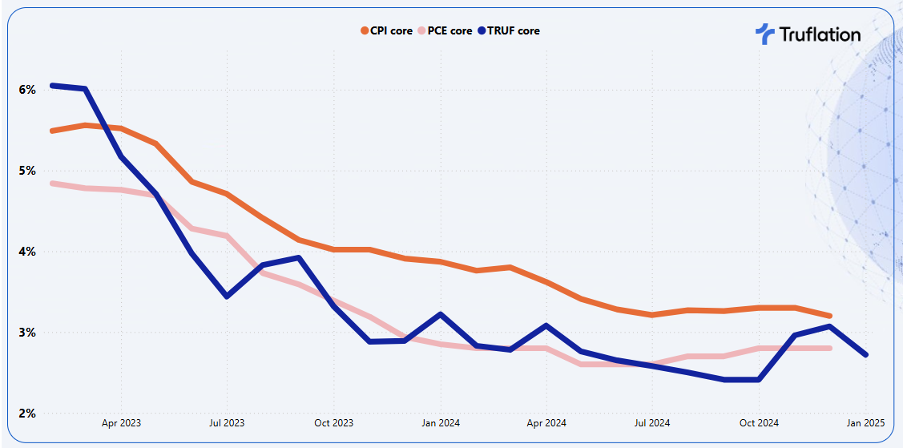
However, in January we expect inflation to marginally de-accelerate as we come out of the festive season and consumers pull back on their expenditure and return to their normal buying behavior.
Truflation provides a range for its forecast for January CPI, given the new weighting that the BLS applies on the January numbers are only released with the results. Having said this we are expecting to see a slight decrease, ranging from 2.6% to 2.8%, with our expected number coming in at 2.7% YoY from December’s 2.9%. With this decline which is expected we should not read that this represents a relief on inflationary pressures as it is the normal impact of January post festive blues. The market expectation is ranging from 2.6% to 3.0% for January The projection for the longer term remains clear with upward inflationary pressures especially following the most recent tariffs on China and their associated retaliatory actions combined with future expected tariffs on Canada, Mexico, Vietnam, Taiwan, South Korea, Japan etc.
Core inflation has experienced a month on month decline but over the last couple of months has been increasing which is a concern given its broad signal for more persistent inflationary pressures. The second big driver is services inflation, which continued to be driven by the tight labor market and wage inflation surging again. Thirdly, food in particular, which is considered a volatile category, has seen sustained price increases and given its persistence even when we expect food prices to come down in January with the post-holiday blues, it re-enforces that inflation is sticking around longer than we have hoped.
Exhibit 2 – Truflation key inflationary metrics: Goods vs Services vs Core Inflation
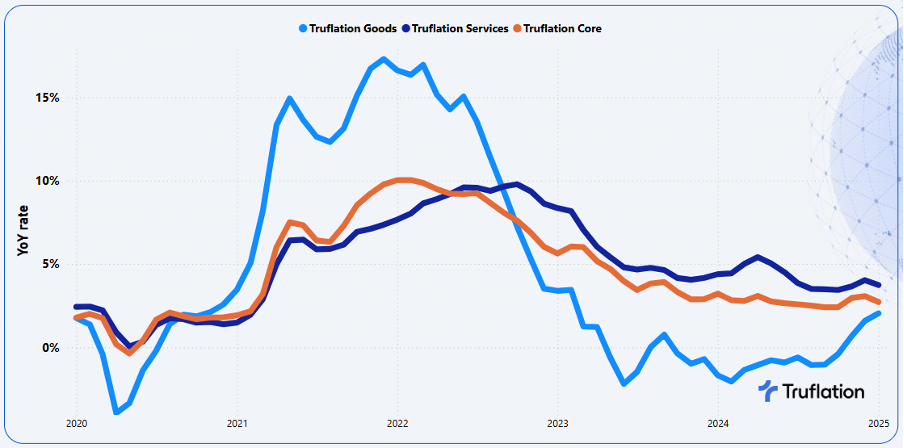
Given the persistence in inflation across so many categories, it is likely that the Federal Reserve will continue to tread cautiously in its policy decisions as we look further ahead into 2025, while Inflation will continue to be influenced by the tight labor market and the economic policies implemented by President Trump.
Exhibit 3 – Truflation key inflationary metrics: Goods vs Services vs Core Inflation
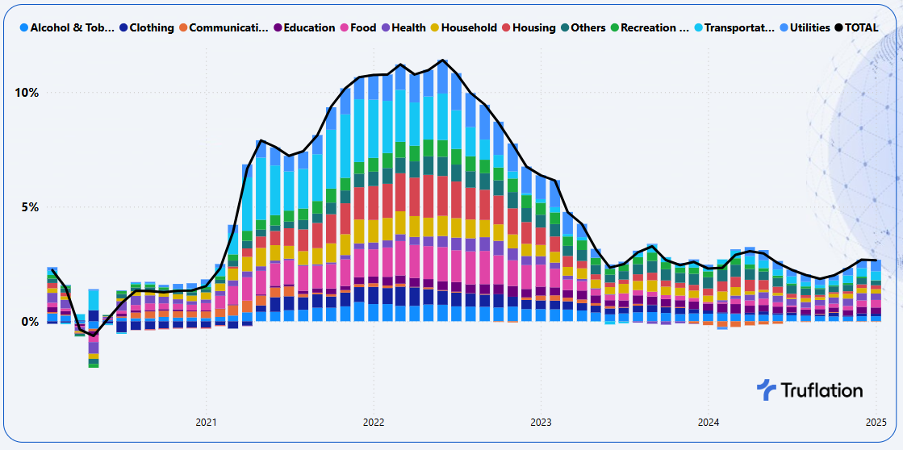
It is clear that there is very little to indicate that inflation will retreat anytime soon, rather more risk to the upside.
Sector-Specific Inflation Analysis
- Food: Prices continued to rise +0.3% MoM and +3.5% YoY, despite the festive season coming to an end and the usual premiumization behavior coming to a screeching halt, but this has not been the case. This trend however, is significantly more evident in the dining out of home segment which is significantly impacted by the labor market conditions.
- Utilities: Prices increased 0.3% MoM and 5.4% YoY, driven by higher costs of natural gas, fuel oil and other fuels. The contributing factor to this rise, is the elevated demand for electricity during this harsh winter, especially for the North East, when temperatures are close to be the coldest on record.
- Housing: Overall housing prices increased by +0.2% MoM and +1.8% YoY. However, the housing market has highlighted very mixed signals: in particular, with owned housing seeing a growth of +1.0% MoM and +2.8% YoY. Rented housing, on the other hand, was relatively stagnant -0.0% MoM and +0.5% YoY. Home sales in the final months of the year showed solid recovery despite the elevated mortgage rates. It is not surprising that winter months are softer than spring and summer but the momentum is rising with sales climbing year over year for three straight months. The job market and wage gains along with increased inventory seem to be positively impacting the market. The other factor in the Housing segment is Other Lodgings that include Hotels and Airbnb etc, which as expected, has seen a significant drop in January compared to December.
- Clothing: This sector experienced a -1.3% MoM decline and on an annualized basis, increased +1.2% YoY. The main factor is that we started the new year returning to their normal behaviour combined with retailers adjusting their pricing strategies to cater to the more cost conscious consumer.
- Household Durables: Prices dropped -0.5% MoM and +2.0% YoY which is driven by the decline in the goods compared to services of Household durables remaining flat which is not surprising given the post-holiday season.
- Alcohol & Tobacco: Prices declined -0.3% MoM and +2.4% YoY, driven by alcoholic beverages post the holiday season, when Americans return back to their normal behavior, if not even starting the “dry month”.
Longer term views
The signs for the road ahead will continue to be a bumpy road with more upward inflationary pressures. We have a strong economy with consumers continuing to spend combined with a tight labor market which suggests that the cost of services will remain elevated for now. Combine this with President Trump’s key mandates from his election messaging coming into play, in particular immigration and tariffs which will add fuel to the cost of goods and in turn inflation.
Given the current environment, the market expectation is that the Federal Reserve will adopt a more “wait and see” approach and take a more cautious stance until they have more conviction that inflation is under control.
There are three key factors that are of concern:
- Immigration: The undocumented arrests and deportations have begun and so far has reached over 8000 arrests in the first two weeks of the Trump presidency. There is significant pressure to ramp this up and depending on the speed of which this accelerates, we will get to understand the impact of the removal of undocumented workers from the labor force. The concern is that certain sectors of the economy will be impacted more and will stifle economic growth, especially in the agricultural industry.
- Tariffs: We certainly have seen the first set of tariff impacts between China and the US. President Trump is now expected to announce more tariffs on more countries next week, which would be a significant escalation of his trade war that could help to reduce the budget deficit. It seems China continues to be the main focus area, as there is evidence that China has been circumventing tariffs by masking exports via Vietnam, Mexico etc. There are 8 countries that account for 79% of the US goods trade imbalances with China, Mexico, and Vietnam being the top three (Germany, Taiwan, Japan, South Korea and Canada being the remaining 5).
Exhibit 4 – US Balance of Trade - Goods only - Top 8 Countries
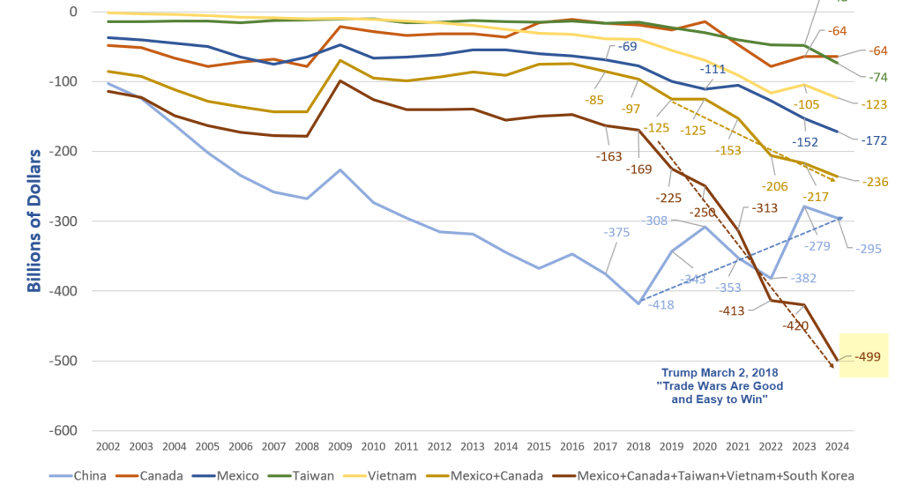
These tariffs would certainly harm the US Auto Industry, with the average price of an imported car from Mexico or Canada increasing from $25,000 to $31,250, if the tariffs take effect. In addition to this, the US still imports 40% of the oil that we need which comes from Canada and from other markets which are at favorable rates - especially from Canada. The US consumers are getting a great deal out of the trade relations and should these actions follow through, then President Trump will make the US the highest cost producer of literally everything and strengthen the dollar and cause further harm to US exports.
- The employment market: Hiring rates are normalizing, while unemployment has started the year at 4.0% up from 3.7% at the start of 2024, which based on the historical average, is low. With the continued growth in wages bolstering purchasing power it will no doubt support consumer confidence and as a result retail spending. However, we do need to keep a cautious eye on debt balances and delinquencies.
The concerns of immigration crackdown and the board tariffs on imported goods could severely curtail both the labor market and economy in the coming months. The lingering uncertainty on tariffs could discourage businesses from expanding, hampering employment growth.
Exhibit 5 – Consumer Inflation Expectations (2% is the Fed Target)
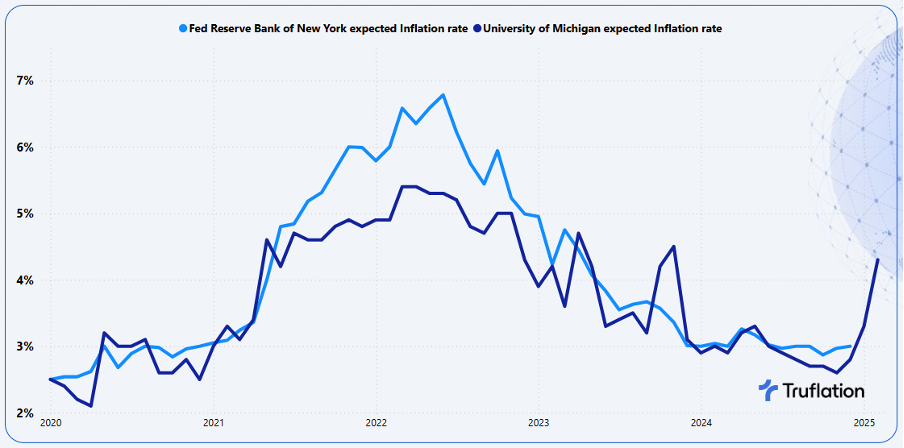
Fears of higher prices from tariffs sent consumer 12 month inflation expectations soaring to more than one year high in February, the survey from University of Michigan showed, which is certainly likely to worry the US Central bank officials.
Conclusion
In the short to medium term, we expect inflation to remain elevated and have greater risk to the upside than downside. The consumer remains resilient and will continue to retain jobs, supporting their growing purchasing power which will support economic growth.
About Truflation
Truflation provides a set of independent inflation indexes drawing on 60+ data partners/sources and more than 30 million product prices across the US. These indexes are released daily, making it one of the most up-to-date and comprehensive inflation measurement tools in the world. Truflation has been leveraging this measurement tool to predict the BLS CPI number with remarkable accuracy. We have successfully predicted the number with precision in 6 of the last 8 months. In 2024, our forecasts had an average deviation of just 0.06%.
APPENDIX A
Truflation Category Percentage Change Data
Month-over-Month and Year-over-Year
All Data is based on January 2025
Truflation Website | TRUF.Network | X | Linkedin | Discord | Telegram | Github| YouTube
Truflation
Privacy Policy | © 2025. Truflation - All Rights Reserved.