Truflation US Inflation Update for March 2025
Published 09 Apr, 2025
Executive Summary
Recent tariffs have sent everybody scrambling to revise their economic forecasts. With at least 10% tariffs on most countries and with higher rates for other major trading partners, they are likely to have a complex and long-lasting effect on the economy.
The latest GDP forecasts are suggesting a significantly lower rate than previously projected. The US economy expanded 2.4% in Q4 2024 with Q1 forecasts ranging from 0% to 0.9% in Q1 2025. The outcome is uncertainty as the policy has broadened the spectrum of potential growth outcomes. Nomura expects inflation as measured by core PCE inflation to run at 4.7% at the end of the year, up from 3.5% in their previous forecast and the current 2.8%.
JPMorgan forecasters have raised their risk of a global recession up from expected 40% to 60% in March. Recession could be short-lived, but if the tariff hikes are maintained, they will permanently reduce the real GDP and real living standards for the average American. As much as these tariffs can be an effective for achieving economic and strategic objectives of the current administration, the latest data sends a message of uncertainty:
- Rising Disposable Income & Retail Sales: The continued growth in disposable income and increase in savings rates are positive signs. Retail sales however have seen a modest growth of 0.2% MoM, which was driven by food and ecommerce while the other remaining categories experienced declines. This reinforces the growing uncertainty over the economy.
- Savings Rate: According to the Bureau of Economic Analysis the savings rate has continued to increase from 3.3% in Dec to now 4.6%. It seems that consumers have started to save again against the rise of uncertainty.
- Consumer Confidence: Truflation’s Consumer Confidence declined for the 4th consecutive month in March as consumer expectations remain pessimistic as households fear a resurgence in inflation from tariffs.
- Labor Market: This shows continued resilience but tariffs and DOGE are set to bite in the coming months. Unemployment remains little unchanged at 4.2%, having remained in the 4.0%-4.2% range for the past 10 months.
- Wages: Wage growth continues to slow down to 3.8% YoY growth in March combined with the increase in savings rate supports that consumers are preparing for what is to come.
All this raises the question of whether the Federal Reserve is actually going to cut rates again in May. According to the CME FedWatch the market is split as to whether there will be a rate cut at the next meeting with 48% expecting a 25 bps reduction. Jerome Powell has stated last Friday that he expects the tariffs to raise inflation and lower growth and indicated that the central bank won’t move on interest rates until the Fed gets a clearer picture on the ultimate impacts. The Fed faces an uncertain outlook due to the new reciprocal levies but believes the economy is strong.
Recent inflation trends
The Federal Reserve is charged with keeping inflation anchored with full employment, but the Fed focus will be on keeping inflation expectations in check, which is something that might not be easy to do with the tariffs, especially with retaliatory measures being announced. Typically tariffs generate a temporary rise in inflation but it is also possible that the effects could be more persistent.
Core PCE inflation ran at a 2.8% annualised rate in February, part of a general moderating pattern which is still well above the Fed 2% target. Add this to the recent consumer surveys which are showing rising concerns about inflation and dimming expectations of future growth is another data point of the challenging position the Federal Reserve is in at present
Companies have been sending out warning signals of higher prices and less demand, coinciding with economic forecasts that suggest a risk of stagflation and rising odds of a recession.
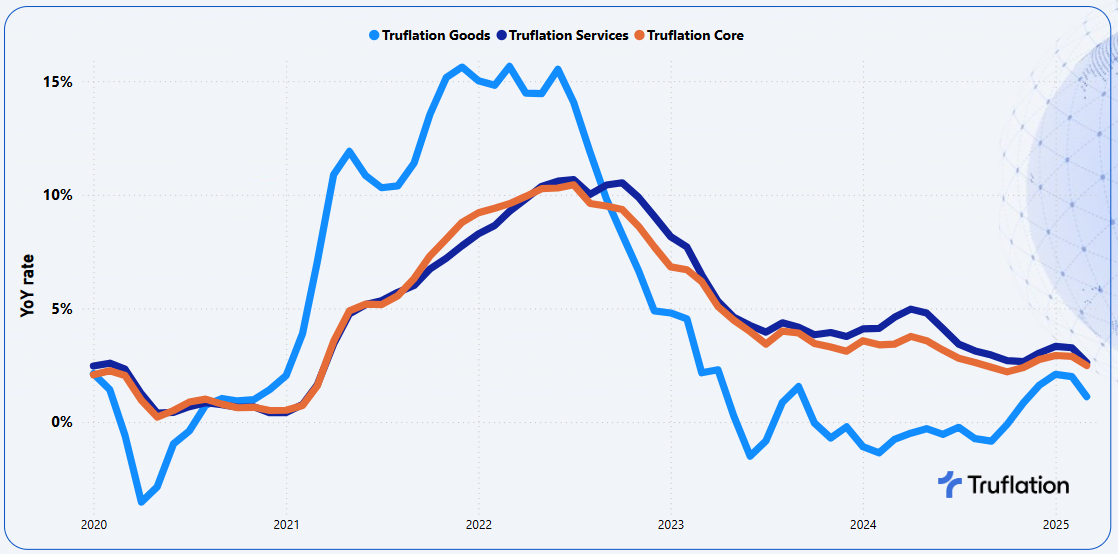
Truflation is forecasting a continued decline in CPI reading for March, with an annualised increase of 2.5% YoY in March from February 2.8% YoY. This projection aligns very closely with the broader market expectations, which ranges from 2.4% to 2.8%.
The non-core categories are the driving force with gradual moderation while the core categories have held up more significantly. The secondary driver of inflation this month is the prices of goods which have seen a significant drop compared to services as consumers take advantage of the price discounts and promotional activities before the broad tariffs come into effect on the 2nd of April.
Exhibit 1 – Truflation key inflationary metrics: Goods vs Services vs Core Inflation
A tariff induced economic downturn may be enough to prompt the Federal Reserve to cut despite the elevated inflation. This would certainly be a departure from the Fed’s typical inflation playbook, which calls for restrictive policy to temper price pressures. The market seems to be more concerned with economic growth than they are with inflation from the tariffs. Having said this, it is unlikely that the Fed moves away from its inflation mandate altogether. They might be slower to support the economy and the labour market, than they otherwise would if the inflationary pressures weren’t present.
Exhibit 2 – Truflation key inflationary metrics: Goods vs Services vs Core Inflation
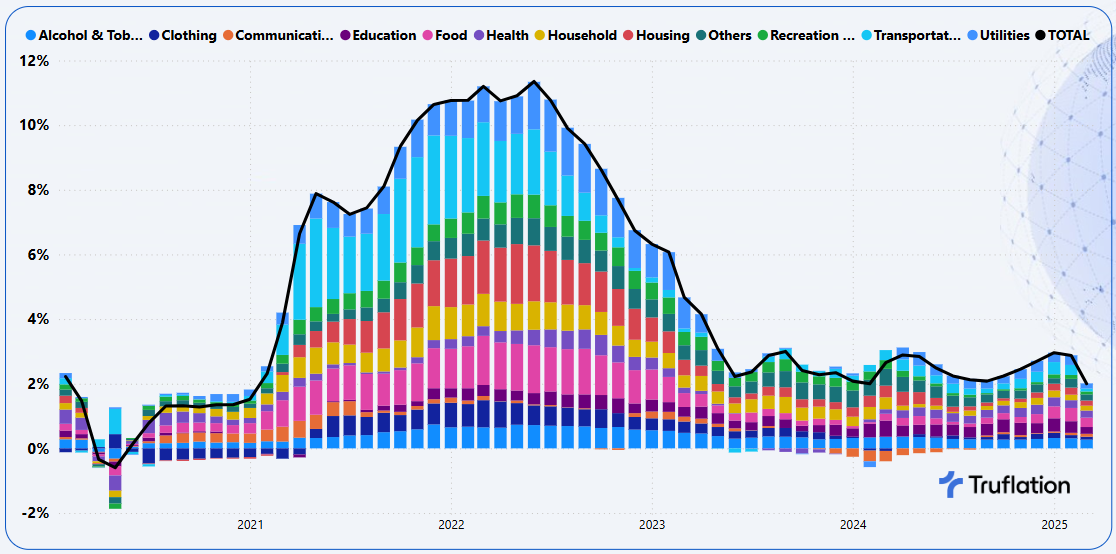
The most significant downward contributing categories to inflation in March are coming from food, transportation and education while housing, utilities and apparel are the biggest upward contributors.
Sector-Specific Inflation Analysis
- Food: Prices dropped -0.3% MoM and +3.7% YoY with both food at home and food away from home experiencing declines but it was food away from home that was the biggest contributor. Prices of food are getting closer to the 20 year historical average. The contributors to the current food prices is the cost of labour which has been gradually reducing and secondly the reducing cost of goods which is evident in the price of eggs. The PPI for food, which is a good indicator of trends to come in inflation, has been on the rise since August last year, thus the current relief in food prices is expected to be short-lived.
- Transportation: Prices saw a notable drop to -0.0% MoM and +1.2% YoY with the single biggest driver being the price of gas at the pump which has seen a significant decline. Vehicle prices on the other hand have seen an increase for the second month in a row, suggesting the steel tariffs are slowly being passed on to the consumer.
- Education: Despite having a 2.3% contribution to overall inflation, prices have declined -0.4% MoM and +2.7% YoY with the driver being education fees. The rate of increase of college fees has been declining due to institutional cost control and a shrinking pool of prospective students leading to greater competition among colleges.
- Housing: Overall housing prices rose +0.4% MoM and +2.0% YoY. It is the rented prices that have seen the largest increase in this category +0.8% MoM and +1.84% YoY. This is driven by the low inventory levels, barriers to homeownership, expired rent freezes and discounts and shifts in tenant demand, especially as more demand to live alone. The owned has seen a moderating growth of +0.2% MoM and +2.6% YoY. Home buyers are slowly entering the market despite mortgage rates not changing much but more inventory and choices are releasing pent up housing demand.
- Utilities: Prices rose +0.8% MoM and +2.1% YoY as is evident across all sub-categories in particular electricity and natural gas which is driven by a significant increase in wildfire related costs (especially California), ambitious environment policies which leaves companies charging their customers more so they can upkeep the infrastructure and of course the extended winter in certain parts of the country.
- Apparel: Prices have started to creep up +2.6% MoM and +1.2% YoY as companies start to bake in the impact of tariffs. With the tariffs finally coming into play on the 2nd of April it is very likely that we are going to see a significant increase in prices as a result. According to the Yale Budget Lab, they see a potential increase of 16.9% in the prices of clothing and footwear. It is very hard finding anything that is made in America thus it is likely that the increases to a degree will be passed on to the consumers.
Longer term outlook
Inflation-weary Americans may soon find that they are paying more for a host of products after the two new types of tariffs come into effect on Liberation Day. These fears of higher prices from tariffs have sent consumer 12 month inflation expectation soaring to levels not seen since during the pandemic.
Exhibit 3 – Consumer Inflation Expectations (2% is the Fed Target)
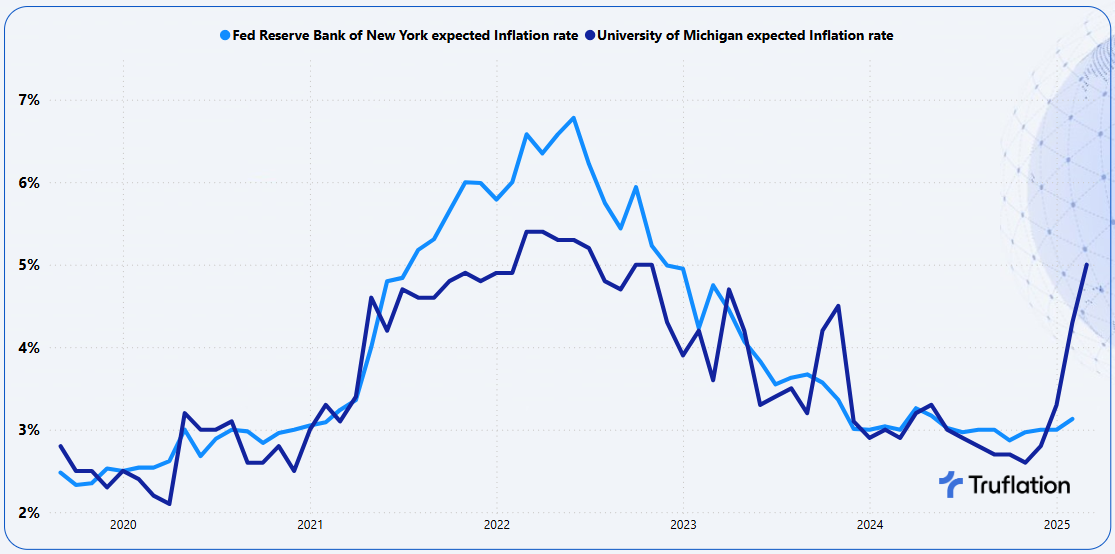
The new tariffs introduced include a 10% universal tariff as well as so-called reciprocal tariffs on more than 60% of today's US trading partners. These tariffs are additive. These increases faced by US businesses will inevitably result in higher prices for consumers. They also have the potential to limit growth, business investment, exports and manufacturing output as the country’s factories face retaliation abroad. US tariffs will approach levels not seen since the Smoot Hawley Tariff of 1930 which incited a global trade war and deepened the Great Depression.
At present there are some exclusions to the tariffs that include semi-conductors, pharmaceuticals and critical minerals. Estimates of the cost to the American consumers varies significantly, but analysis done by The Budget Lab at Yale University estimate that tariffs will cost the American household an extra $3,800 this year, an increase of approximately 2.3%.
So what categories are likely to be affected in the coming weeks and months as companies digest the import duties and their prices in response.
- Food: Various food and household items from fruits to staples are expected to rise simply because products like coffee, oats, cocoa, spices, tropical fruits and products using steel are not available in the US. It will also impact specialty components of categories like household and personal care products.
- Electronics like iPhones, Computers and TVs: Among the nations targeted are China, Taiwan and South Korea, who are top exporters of electronics to the US from Apple iPhones to television sets.
- Automotive: On top of the previously announced 25% tariffs on auto imports the industry will also be impacted by the 10% universal tariffs. Some US made vehicles include parts imported from other countries which will face new tariffs and increase the purchase price on those cars. Impact ranges from $2,500 to $5,000 for the lowest cost American cars and up to $20,000 for the imported models according to the Anderson Economic Group.
- Clothing and shoes: The bulk of apparel and shoes sold in the US through the likes of Walmart, Target and Amazon are manufactured outside the US with China, Vietnam and Bangladesh being the biggest exporters. These three nations will face reciprocal tariffs at 34% for China, 46% for Vietnam and 37% for Bangladesh.
- Toys: Roughly 80% of the toys sold in the US come from China and they are expecting a 34% tariff.
- Wine & Spirits: Italian and French wines, Scottish whiskey are also likely to rise in prices as the EU imports will face a 20% reciprocal tariff while products made in the UK will face a 10% import duty.
- Furniture: About 30-40% of furniture sold in the US are manufactured in other countries in particular China and Vietnam. Add on top of this the lumber import duties from Canada will mean not only imported products but also products produced in the US with Canadian timber.
- Coffee & Chocolate: US imports 80% of its coffee beans from Latin America according to the Department of Agriculture, in particular Brazil; and Colombia. Both nations are facing 10% duties. Then you have cocoa which are imported from Cote d’Ivoire and Ecuador as the US climate is largely unsuited to growing cocoa beans.
These categories are on top of the impacted categories of housing and fuel prices that we spoke about in our last month's Inflation Report.
You combine these impacted categories with immigration and the overall employment market, we are likely to see more upward inflationary pressures on goods as well as services. Not only is this an story about inflation but also about its impact on economic growth.
Conclusion
In the short to medium term, we are going to have a couple of one-time adjustments to inflation with the question of how resilient the consumer remains supporting growth with increased indicators that should be at a minimum a note of caution.
APPENDIX A
Truflation Category Percentage Change Data
Month-over-Month and Year-over-Year
All Data is based on March 2025
About Truflation
Truflation provides a set of independent inflation indexes drawing on 30+ data partners/sources and more than 14 million product prices across the US. These indexes are released daily, making it one of the most up-to-date and comprehensive inflation measurement tools in the world. Truflation has been leveraging this measurement tool to predict the BLS CPI number, with a 99.94% accuracy in predicting inflation in the last 12 months.
Truflation Website | TRUF.Network | X | Linkedin | Discord | Telegram | Github| YouTube
Truflation
Privacy Policy | © 2025. Truflation - All Rights Reserved.