Truflation: US Inflation Update June 2024
Published 10 Jul, 2024
Executive Summary
Recent data continues to signal that the US economy may be cooling. While the labor market has remained resilient, it has shown signs of weakness, with the number of job openings holding steady in June compared to May, but down 1.2 million versus last year. We may finally return to an equilibrium of 0.8 unemployed persons per job opening, below pre-pandemic levels. Wage growth is also slowing, though, for now, it continues to outpace inflation. However, consumers are still prepared to spend and drive economic growth despite a cooling in spending.
We expect to see a short-term dip in inflation from here, but longer-term concerns must still be addressed. This includes housing prices, increased supply-chain costs, the geopolitical environment and student loan forgiveness.
Market expectations for the Bureau of Labor Statistics’ (BLS) CPI release on July 11 range from 2.9% to 3.4%. Truflation is expecting the CPI for June to come in at 3.0%. The key highlights from Truflation’s June Inflation Report are:
- We expect the month-over-month (MoM) change in inflation to be negative for the first time in the last 42 months, but only just.
- The slowdown in the rate of inflation growth is due to the gradual softening of the labor market which, in turn, is pulling down the price of services (except for healthcare).
- Housing prices have shown some signs of cooling, driven by the gradual decline in 30-year mortgage rates throughout June. However, inventory constraints remain, so if demand jumps as expected when rates come down it will drive prices back up again.
- Supply-chain constraints, rising commodity prices, logistics costs and geopolitical tensions are the key concerns for the future.
Recent data highlights that the path to lower inflation remains extremely bumpy and progress will be slow. This will continue to be a drag on American hard-earned finances. Combined with a recent fall in the Atlanta Fed’s Q2 GDP forecast to 1.5%, this will undoubtedly lead to increased pressure on the Federal Reserve to loosen monetary policy.
Indeed, we expect this CPI release to act as a catalyst to reignite hopes that the Central Bank will cut rates more than previously anticipated, perhaps driving the return of expectations for two cuts this year or a bigger cut in September. However, we still believe a slower rate of cuts (smaller and more often) will be more positive for the markets and the consumers.
Recent inflation trends
Inflation has been hanging around much longer than expected and has held steady since the beginning of the year. In fact, it has ticked up marginally from 3.1% year-over-year (YoY) in January to 3.3% in May – though over the last few months, it has begun cooling again, down from 3.5% in March to 3.4% in April. Overall, though, it appears elevated inflation has yet to disappear.
Against the background of this slow gradual decline in price growth, the Fed has signaled that it will cut interest rates just once this year. In contrast, in March, officials expected to drop rates three times this year. However, with inflation remaining above the 2% target and only modest progress on taming it, policymakers remain cautious. It is therefore likely that, without significant progress on inflation, we will see fewer interest rate cuts this year (one or two) – and not significant ones at that. In addition, this is not likely to happen until after the summer at the earliest.
The US employment market remains robust, with the number of job openings holding steady at 8.1 million on the last business day of May, as reported by the BLS Job Openings and Labor Turnover Survey (JOLTS). The number of hires and separations saw little change. This suggests that demand for labor has been holding steady as businesses take a cautious approach to hiring new workers.
In addition, the most recent data shows that US employers added 206,000 jobs in June, marking another healthy month and coming in above expectations of 190,000. This, once again, displays the US economy’s ability to withstand continually high interest rates due to its strong consumer-driven economy. Jobs growth in May did get revised down from 272,000 to 218,000, but this still marks a strong gain.
The majority of the new jobs continued to be created in government, healthcare, social assistance and construction. The overall unemployment rate ticked up only slightly from 4.0% to a still-low 4.1%; this highlights the difficult position the Fed finds itself in. It is trying to react to the data, while at the same time not overreacting to it – all while the ECB and the Bank of Canada have already begun cutting interest rates.
Economic activity in the manufacturing sector contracted in June for the third consecutive month and the 19th time in the last 20 months – with just one month posting an increase. The Manufacturing PMI fell 0.2 points to 48.5 in June from 48.7 in May.
But this hasn’t affected purchasing behavior, as monthly retail sales saw a marginal uptick in May with a 0.1% MoM growth – up from a decline of -0.2% in April. This still marks a slowdown from February and March, when retail sales grew by 0.4% MoM respectively, but YTD spending growth remains healthy at 2.1%.
If we look at consumer spending, which accounts for more than two-thirds of US economic activity, we have seen an increase of 0.25% MoM in May, down from a 0.7% MoM increase in March but up from 0.14% in April. Clearly, consumers are feeling the pinch of higher prices, and it finally appears that spending might be cooling, which is encouraging news for a slowdown in inflation.
Coupled with wage growth continuing to slow down to 4.87% while savings rates have increased marginally to 3.96%, this might just mean consumers are taking a breather and preparing for better times ahead.
However, to definitively bring inflation back down to the 2% target without tipping the economy into a recession, policymakers will need to continue their efforts to reel in consumer demand.
Chart 1: US Personal Consumption
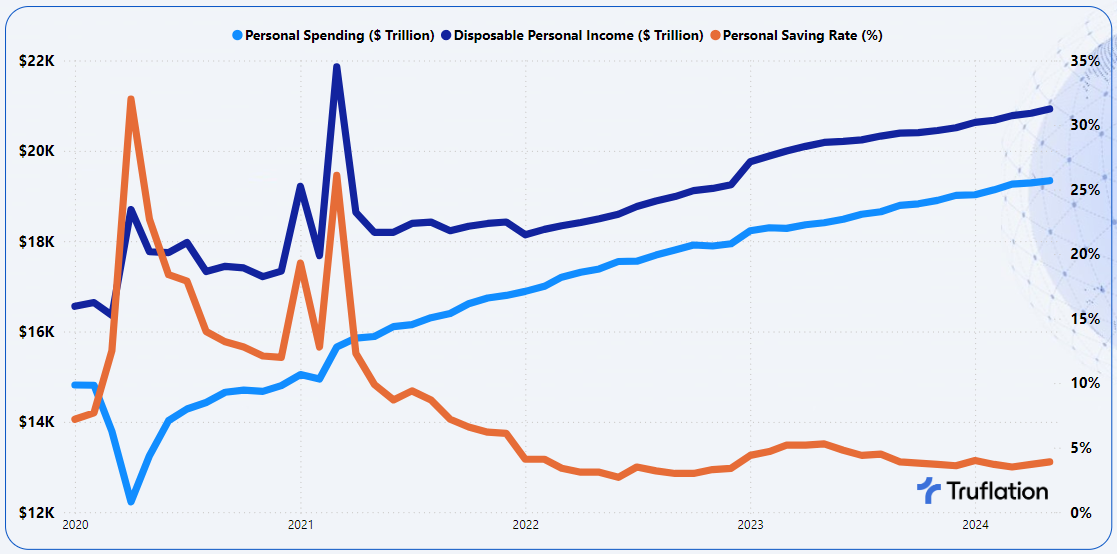
Source: Bureau of Economic Analysis, Personal Income and Outlay Report
In June, we also saw a marginal increase in credit card delinquencies, from 3.07% to 3.16%. This continues to suggest that the pressure of higher interest rates is taking its toll.
The net impact of all this data is that the Atlanta Fed has reduced its GDPNow forecast for real GDP growth in Q2 from 1.7% on July 1 to 1.5% on July 3. This reinforces the expectation of a slowdown in consumer expenditure.
In this more subdued environment, it is not surprising to see Truflation’s Consumer Confidence Index continue to fall from 89.18 in May to 88.58 in June. This marginal drop in confidence is due to cracks starting to emerge in the labor markets, and if the conditions worsen, we would certainly expect this number to drop even further. This is also reinforced by the Index of Economic Conditions, which tracks future expectations and has continued to deteriorate, putting further pressure on the Fed to reduce interest rates faster.
Chart 2 – Truflation Consumer Confidence Trends

However, while overall consumer confidence is faltering, their outlook for the stock market remains positive, and the expectations of interest rates dropping later this year will no doubt drive further optimism in the coming months. Combined with strong, albeit slower wage growth and healthier household balance sheets, this will continue to buoy consumer spending despite elevated prices and borrowing costs in the short term.
Against this backdrop, we have seen a continued slowdown in services inflation, especially with wage growth slowing over the last couple of months. Meanwhile, the goods sector has also seen a declining trend. This can, in part, be explained by increased discounting activity to remove excess inventories and cooling commodity prices.
Overall, 84% of category contributions are experiencing a monthly drop in inflation. The major contributors on the downside in June were housing, transportation and clothing, while health, education, and communication were the biggest upward inflation drivers.
Chart 3: Truflation Category Percentage Contributions to Truflation CPI

Categories applying downward pressure on prices
In May, the categories that exerted the greatest downward pressure on prices were housing, transportation and clothing.
Housing is a significant contributor to the overall inflation figure with a 23.2% category weighting. It has seen prices decline -0.3% MoM, marking the first monthly decline in five months, but remains up 2.1% on an annual basis. This decline was driven by the owned dwellings, where prices are down -0.4% MoM, but up +3.4% YoY, while rented property prices remained stable compared to the previous month.
The most recent figures reveal that new residential home sales dropped by -11.3% MoM in June. Existing home sales saw a similar trend, with the number of registered sales down -0.7% MoM, according to the National Association of Realtors (NAR). This is, no doubt, due to the rise in the median price of existing home sales by 3.1%, which marks another increase from the previous month.
At the end of May, the number of unsold existing homes increased by 6.7% MoM to 1.28 million, or the equivalent of 3.7 months’ supply at the current monthly sales pace. Despite this improvement in the inventory levels, which will help to bring prices down in the future, we have seen new residential starts and completes slowing down, recording -5.5% and -14.4% MoM declines respectively. More inventory is needed to lower housing prices.
On the flipside, we continue to see many sellers trying to take advantage of rising prices by listing their existing homes. New listings are up 15% – the most significant increase in nearly three years. This is helping to increase the overall supply, but the increased median prices are resulting in a slowdown of sales activity.
This month’s decline in housing prices for the owned segment was driven by mortgage rates finally settling into a downward groove – at least for now. The average 30-year fixed mortgage rate broke under 7% in June and has continued on this trajectory.
Chart 4: US Weekly Averages as of June 26, 2024
30-Year Fixed Rate Mortgage – 6.86%; 15-Year Fixed Rate Mortgage – 6.16%

Source: Freddie Mac’s Primary Mortgage Market Survey
Many housing market experts don’t anticipate that mortgage rates will recede too much in the coming months, especially if the Fed continues to delay cutting its benchmark interest rate. The expectation is that the Central Bank will cut rates later in the year, so we should begin to see 30-year fixed mortgage rates sliding down to around 6.5% by the end of 2024 (according to Freddie Mac).
The longer-term question is how much pent-up demand is just waiting to be dropped on the market as soon as interest rates come down. If supply hasn’t increased by this time, then the buyers sitting on the edge of the market will only drive prices higher, which will, in turn, be inflationary overall.
The transportation category, which accounts for 19.8% of total household expenditure, has seen mixed results. Vehicle purchases and other vehicle expenses held relatively flat in July, at -0.05% MoM and +0.01% MoM, respectively. Automotive sales also fell marginally to 1.341 million in June from 1.444 million in May. Volumes for 2024 as a whole are positive compared to 2023, but the prices have been affected by discount activity applied by dealerships. However, in June, discount levels were reduced, leading to gradual price increases.
Meanwhile, gas prices were the key driver of the decline in the transportation category, down -3.62% MoM and -2.64% YoY. This decline was seen across the US, bringing some relief to drivers, who are now paying a little less to fill up their tanks. During the first half of the month, the decline was driven by a blend of lackluster demand and strong supply, as well as relatively mild oil prices. It appears that fewer people are currently hitting the road, as demand has been fickle. Normally, one would expect to see a pick-up in demand in the summer after Memorial Day, but we haven’t seen that this year. With the onset of the Fourth of July celebrations, though, demand can be expected to rise again in the back end of June and early July.
Beyond this, the EIA has also highlighted that the total weekly stock of gasoline in the US has been declining in the most recent week, no doubt to offset the corresponding increase in WTI oil prices.
Chart 5: EIA oil & Gasoline Reserves

Source: EIA US Petroleum Balance Sheet Report
However, the Strategic Petroleum Reserve (SPR) has been growing again, despite non-SPR stocks and gas dropping in the last couple of weeks. This is likely due to the completion of refinery maintenance, which has resulted in increased output/utilization of the nation’s refineries.
Gas prices will also be impacted by the Biden administration announcing last month that it would be releasing 1 million gasoline barrels (or approximately 42 million gallons) from a Northeast reserve with the aim of lowering prices at the pump this summer, especially after the price increases we saw in recent weeks.
The third major category contributing to a drop in inflation was clothing, where prices have declined -0.72% MoM, with annual inflation now at +0.76% YoY. This continued to be driven by women's clothing and apparel rather than men’s clothing, where prices have increased by +0.23% MoM and +2.21% YoY. It appears consumers are still not willing to pay higher prices for something that is not a necessity. This lower demand for clothing has kept prices from rising and, to a certain degree, has driven price discounts and promotions.
To compensate for the drop in demand, apparel retailers have been focusing on improving inventory management. However, as we enter the summer months, new collections will arrive to spur consumer spending, which will increase inventory levels once again. Yet retailers are likely to be more calculated in terms of the stock they hold on their balance sheets and thus return to a greater equilibrium that will no doubt allow them to increase prices soon.
Categories applying continued upward pressure on inflation
In June, most of the upward pressure on inflation continued to come from health, education and communication. On the whole, this has been driven by the tight labor market. However, even though these categories are holding inflation higher, the rate of price growth these categories are posting has been slowing down.
The upward pressure on inflation from health, where prices have increased +0.38% MoM and +3.01% YoY, is a result of the increased costs across both the goods and services elements. Increases in health insurance continue to be driven by rising pharmacy costs, technological advances, administrative cost increases and government regulations.
Chart 6: Truflation Health Price Trends

Higher employment growth and wage increases have continued to apply pressure on the healthcare industry to increase the prices of services and drugs. This increased price pressure is unlikely to subside in the future and we expect to see healthcare prices rising faster than general inflation.
The second inflationary category is education, which has increased +0.25% MoM and +3.04% YoY. The increased costs in the education sector have been consistent for the past year, rising on average by +0.25% every month, so this month is no different.
Several factors can explain these increased education costs:
- Tuition fees have been rising steadily due to cuts in state funding, increased demand for higher education, rising administrative and operational costs and the need to offer more student services.
- According to the National Education Association, the average teacher’s salary rose by a record 4.1%, but this is still not enough to keep up with inflation and is unlikely to be enough to ease the staff shortages in the industry.
These factors, combined with the cost of education materials and extra services, are the key drivers for the category price increases.
Finally, the communication category has seen prices increase by +0.14% MoM, though they are down -1.12% YoY. This category is a mixed bag. On the one hand, cellular phone services have seen a decline in prices amid heated competition between providers and consumers seeking cheaper deals.
On the other hand, though, residential phone service prices have been gradually increasing and showing no signs of slowing down. June was no exception, with a +0.58% MoM rise and a +1.94% YoY increase.
These price increases stem from carriers adopting market-based pricing on their new and improved services after removing previous price caps on analog-based services. Carriers have been investing to remain competitive and offering new and improved services by switching to alternative options, which has allowed them to charge customers the actual cost of landline services. Demand for these improved services has been on the rise as customers switch from the analog system, which suffers from high maintenance and repair costs, to the old copper wire technology.
Short-term gains vs long-term concerns
Although we expect June’s drop in inflation to be more dramatic than we’ve seen in recent months, Truflation expects the CPI number to come down even further over the short term. This will be driven primarily by the services element, with the labor market showing signs of softening.
At the moment, wages are still outstripping inflation, but we expect to see them gradually come down, which will apply calming pressure on services over the long term. Other factors, such as the impact of the Inflation Reduction Act on green energy, will also gradually reduce energy costs.
However, Truflation is more concerned about the longer-term outlook for inflation and believes that several elements must be addressed, namely:
- Housing prices need to drop further, given the category’s contribution to household expenditure. So far, consumers have been purchasing properties at elevated interest rates, with the expectation that housing prices will increase in the future due to low inventory availability and a surge in demand when the Fed finally cuts rates.
- High shipping costs for the transportation of goods from around the world to the consumer in the US are likely to last through to Q4 2024; these will need to be addressed before we see further declines in goods prices.
- The Biden administration has waived student loans worth a total of USD $167 billion, which will undoubtedly have an inflationary impact.
The latest consumer-based Inflation Expectations Survey from the University of Michigan, which represents the sentiment of American households, reveals that consumers expect inflation to come down to 3.0% next year, which marks a reversal from the previous month’s survey, which saw consumers expecting a further increase. This trend is also reinforced by the Survey of Consumer Expectations from the Federal Reserve Bank of New York, which has seen a drop in inflation expectations from 3.26% to 3.17% by this time next year. It seems that, in general, consumers are increasingly optimistic that inflation will be tamed, but only gradually.
Chart 7: Consumer Inflation Expectations (2% is the Fed Target)

Source: University of Michigan & Federal Reserve Bank of New York
__
About Truflation
Truflation provides a set of independent inflation indexes drawing on 30+ data partners/sources and more than 14 million product prices across the US. These indexes are released daily, making it one of the most up-to-date and comprehensive inflation measurement tools in the world. Truflation has been leveraging this measurement tool to predict the BLS CPI number, with four predictions spot on and all but one deviating by no more than 20 basis points since coverage was initiated.
APPENDIX A
Truflation Category Percentage Change Data
Month-over-Month and Year-over-Year
All Data is based on June 2024
Truflation
Privacy Policy | © 2025. Truflation - All Rights Reserved.