Truflation: US Inflation Update November 2023
Published 11 Dec, 2023
Executive Summary
The labor market remains tight, which continues to push up the price of services, and we don’t expect this trend to reverse any time soon. At the same time, consumer spending remained strong in October (though less so than the previous month) and confidence has seen a minor uptick, which points to US consumer resilience. Combined, we expect these trends to contribute to sticky inflation that will be hard to shift.
Truflation expects the BLS inflation reading for November to come in at 3%, with economists’ expectations ranging from 2.9% to 3.4%.
The key highlights of this month's Inflation Report are:
- Housing prices are finally losing a little steam, but high mortgage rates, elevated home prices, and tight inventory are set to perpetuate the housing affordability crisis.
- Transportation prices keep falling due to excess vehicle supply and an 8% drop in Crude oil prices in November (on top of October’s 9% fall). However, the ongoing Hamas war and OPEC+ production curbs may push prices higher again in the future.
- Food, health, household operations, and communications were the biggest upside contributors to inflation in November. There are still inflationary pressures here from the services element, driven by the tight labor market.
- Services inflation remains stubborn, rising in November. This, combined with another monthly increase in core inflation, will give the Federal Reserve food for thought.
It is increasingly evident that inflationary pressures are likely to last longer than anticipated as a result of the continued tightness in the labor market, rampant consumer spending, and elevated services prices. We believe an economic slowdown will be required to bring inflation down to the Fed’s 2% target.
Coupled with potential oil price increases down the line, this fuels our expectation that inflation will hold at 3.5% at the end of 2023 and only begin to abate gradually in mid-2024.
Consumer spending remains strong in a tight labor market
Recent data releases suggest the US economy remains resilient. On November 29, the second estimate for Q3 GDP saw an upward revision from 4.9% to 5.2%, driven by the increase in consumer spending and inventory investments.
Consumers continued to spend in October, though not as strongly as they did in September. Retail sales dropped marginally by 0.1% month-over-month (MoM), though remained positive over the year at 2.5% year-over-year (YoY). The strong annual growth trend has been consistent over the past few months and does not take into account the impact of inflation.
Graph 1: Monthly Retail Sales and Inventories - Adjusted
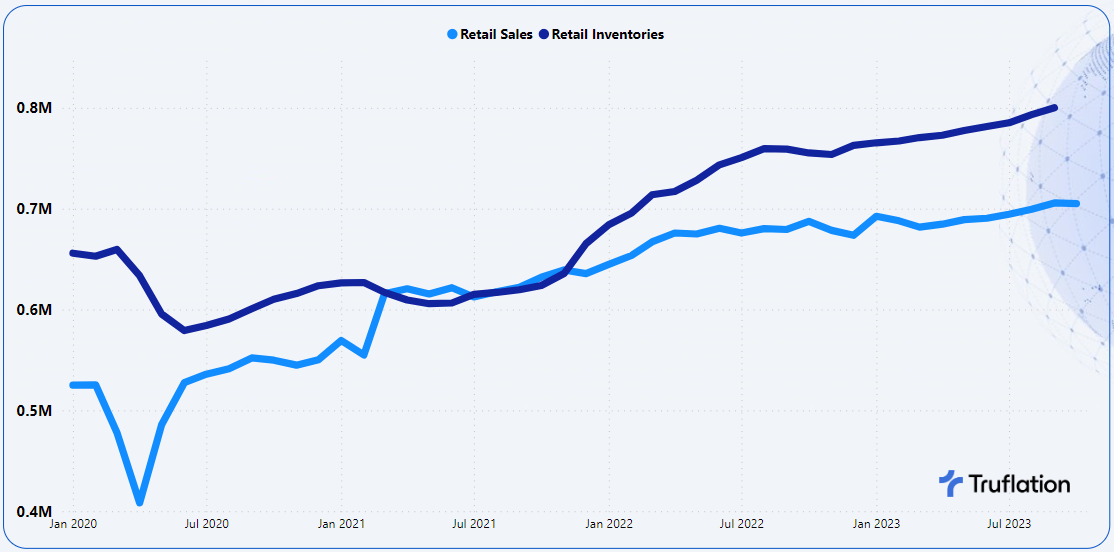
Source: US Census Department; Advance Monthly Retail Trade Survey
The marginal monthly drop in retail sales reflects the continued declines in the motor vehicles and parts dealers category, which saw a 0.95% MoM drop, as well as sporting goods, hobby, musical instruments, and book stores, where sales declined by 0.85% MoM.
Currently, inventory levels remain at their peak, primarily driven by motor vehicles and part dealers, and are still rising on a monthly basis. This suggests that we are likely to see further downward pressure on retail prices in the coming months, in particular in the motor vehicles category.
However, these numbers are also not adjusted for inflation, while strong annualized growth in retail sales points to the resilience of the US consumer. The continued strength in consumer spending certainly adds complexity to the Fed’s next monetary policy decision.
In addition, US personal spending continued to accelerate in November. According to the Bureau of Economic Analysis, this was up 2.1% MoM to $18.86 trillion, marking a 5.2% YoY increase.
This is being supported by the increase in wages thanks to the tight labor market. In October, wage growth outstripped inflation for the fifth month in a row, coming in at 5.7% and reversing the previous month’s downward trend. Households have also been dipping into their savings and taking on more debt to afford their spending habits.
Graph 2: US Personal Consumption; Key Figures

Source: Bureau of Economic Analysis, Personal Income and Outlays Report
The use of credit cards to fuel increased spending is particularly concerning, given the impact of higher-for-longer interest rates on repayments. We have already seen a steady acceleration in delinquency rates on credit card loans, nearly doubling from 1.55% in Q3 2021 to 2.98% in Q3 2023. This marks a 10-year high, though it remains below the delinquency rates of the noughties.
Graph 3: Delinquency Rate on Credit Card Loans, All Commercial Banks

Source: Board of Governors of the Federal Reserve System (US)
Finally, employment has remained tight, with initial jobless claims marginally rising compared to the previous week, but still relatively stable at 220,000 in the week ending December 7th. On top of this, the most recent release from the BLS revealed that the unemployment rate declined from 3.9% in October to 3.7% in November. The US economy added 199,000 new jobs in October, predominantly in healthcare and government.
In the past month, some data pointed to a slowing in the labor market, notably the rise in weekly jobless claims. However, private employment, which makes up a significant part of the labor market, is at a 2023 high of 129,343,000. Total separations are down 6.4% YoY to their lowest level of 2023, while the number of hires has risen from 5,822,000 in July to 5,871,000 in November. Overall, the labor market remains strong and we are unlikely to see the unemployment rate exceed 4% in Q4, despite some economic forecasts.
We expect the ongoing resilience of the labor market to contribute to inflationary pressures. Strong consumer spending and stubborn prices in the services category, which makes up 42% of the US CPI index, will keep inflation elevated for longer than the market is anticipating.
Recent inflation trends
We expect the BLS will report that inflation declined only marginally in November compared to the previous month. The market’s expectations for the BLS November CPI release range from 2.9% to 3.4%. Truflation is expecting the CPI to drop from 3.2% in October to 3.0% in November.
Truflation is seeing continued declines in the prices of goods, particularly in the vehicles category as a result of excess supply. However, services have remained more stubborn and have, in fact, seen price increases in November, driven by strong wage growth and plentiful employment opportunities.
Meanwhile, core inflation – the Fed’s preferred inflation measure which strips out volatile food and energy prices – has seen a marginal uptick again in November, which provides clues as to the key areas that must be addressed to bring inflation down to the Central Bank’s 2% target.
Graph 4: Truflation Core Inflation Measures (Goods vs Services vs Core)

Given the substantial weighting of the services sector and food in the US CPI index, we still believe an economic slowdown will be required to bring inflation down to the Fed’s 2% target. In particular, we need to see further softening in the labor market for prices in the services sector to cool.
Truflation’s Consumer Sentiment Index has held stable this month, with a minor uptick from 86.8 in October to 86.9 in November, following three consecutive months of declines. The small improvement reflects a recovery in consumers’ current economic outlook.
November’s increase in consumer confidence was more concentrated among the older households, but, despite feeling more confident, consumers remain preoccupied with rising prices, followed by war/conflicts and higher-for-longer interest rates.
Graph 5: Truflation Consumer Confidence Trends

The rebound in consumer confidence has implications for Truflation’s inflation outlook. It is clear that as supply concerns have alleviated, price spikes have also begun to unwind. Now, inflation is primarily driven by soaring consumer demand.
Against the backdrop of a tight labor market, inflation has now broadened into many categories, partially offsetting the downward impact of transportation and, for the first time in a long while, housing.
Graph 6: Category Percentage Contributions to Truflation CPI

With this in mind, the most significant upward contributions to inflation in November came from food, health, household durables and daily use items and communications, while transportation and housing were the biggest downward contributors.
Categories applying downward pressure on prices
In November, two main categories contributed to the downward inflation trend: housing and transportation, which make up 23.2% and 19.8% of Truflation’s US CPI index, respectively.
The transport category continues to be the single biggest contributor to the downward trend at -1.15% MoM in November, which brings down the annualized rate to +2.72% YoY. This was driven by a 7.4% drop in gasoline prices last month, with deflation in this category hitting -9.4% YoY. Since crude oil prices peaked on September 27, 2023, we have seen a continuous steady decline.
This trend is even more significant given the fact that we are keeping a close eye on the outlook for oil prices, with the expectation that they may rise again in the short term. Although the conflict between Israel and Hamas hasn’t affected physical oil supply so far, uncertainties surrounding the conflict and other global supply conditions could put upward pressure on crude oil prices in the coming months.
Graph 7: Price of WTI Crude Oil per Barrel
US$74.07 for December 4, 2023

Data Source: Weekly Petroleum Status from the Energy Information Administration
OPEC+, which accounts for roughly 40% of the world’s crude oil production, agreed to voluntary cut output by an additional 2.2 million barrels per day, while no new group cut targets have been set for 2024. However, the expectation is that production growth from non-OPEC countries will offset these cuts and help maintain a relatively balanced global oil market.
The Energy Information Administration’s short-term energy outlook report, published on November 7, forecasted an increase in the price of Brent crude oil from an average of $90 per barrel in Q4 2023 to an average of $93 per barrel in 2024.
The recent drop in the oil price is not the result of a release from the Strategic Petroleum Reserve or a reduction in the Motor Gasoline Reserves. Rather, it is purely driven by market forces.
Graph 8: Truflation Transportation Category Price Trends

Demand for new and used cars has also remained sluggish in the last couple of months and the rising interest rates on financing costs and excess inventory have continued to place downward pressure on vehicle prices. Auto retail inventory rose from $220.7 billion in June to $234.6 billion in September 2023.
As a result, vehicle purchases (new and used) are down 0.19% MoM and 0.36% YoY respectively. As inventory levels outstrip demand, we expect prices in this category to keep falling.
Graph 9: Motor Vehicle and Parts Dealers in $ Millions; Adjusted Sales and Inventories

Source: US Census Department; Advance Monthly Retail Trade Survey
However, public transportation prices have seen a marginal increase of 0.01% MoM and are up 3.44% YoY. In the last five months, we have seen the public transportation category increase from deflation of -6.08% YoY in July 2023 to positive inflation of 3.44% YoY by November.
It is not surprising to see public transportation prices, which include planes, trains, taxis, and subways, increasing again with business and Thanksgiving travel returning. As the festive season kicks in, we are expecting travel to remain elevated.
The Transportation Security Administration’s (TSA) checkpoint daily travel numbers reveal annual increases of 12.8%, 10.6%, and 8.5% in September, October, and November respectively. Fares will no doubt peak in November/December as travelers book last-minute holidays. After this, we expect airfares to return to pre-pandemic levels.
Beyond passenger numbers, corporations are also increasingly encouraging their employees to return to work, which is leading to an increase in commuting.
The other major category pushing inflation lower is housing, which will no doubt bring welcome relief to consumers. November marks the first time that we have seen a negative monthly percentage change since January 2023. Housing inflation this month has come in at -0.68% MoM, contributing to a reduction in the annualized rate to 2.5%.
These price drops are driven by the owned property segment, which is down 0.66% MoM and 3.22% YoY. At the same time, the national average 30-year mortgage rates have finally lost steam over the last five weeks, dropping to 7.22% as of November 29 from a peak of 7.79% on October 25, according to Freddie Mac. To add some context, mortgage rates were in the low 3% only two years ago.
In the face of record home prices and high mortgage rates, monthly new residential home and existing home sales fell 5.6% and 4.3% MoM respectively, according to the Census Bureau and the National Association of Realtors (NAR). Meanwhile, soaring tax premiums continued to apply additional pressure on the owned property segment.
Graph 10: Truflation Housing Category Price Trends

Despite this, the housing market remains competitive as demand continues to outpace supply. Potential buyers with the stomach to stay in the market are buying up the limited inventory, especially new homes, as builders continue to offer incentives to hopeful homeowners. This trifecta of headwinds – the high mortgage rates, the elevated home prices and the tight housing inventory – will no doubt perpetuate the housing affordability crisis.
Two factors are required to bring down house prices. Firstly, home sales inventories would need to turn considerably higher, which would ease the upward pressure on home prices and bring them down from current near-peak levels. Secondly, of course, interest rates would need to cool.
However, the expectations are that neither of these two factors will cool off particularly quickly. And, in fact, rapidly falling rates could create a surge in demand that would wipe away any inventory gains, causing home prices to rebound. It is better from a housing perspective that rates cool at a metered pace, incrementally improving buyer opportunities over time rather than all at once.
Another factor is the spread between the 10-year Treasury bond yield and the 30-year fixed rate mortgage, which is currently hovering around 300 basis points. Historically, this spread should be between 150 and 200 basis points. A more normalized spread would likely prompt more would-be home buyers to re-enter the market. It is anybody’s guess when this spread will begin to narrow but, when this happens, mortgage rates could come down even if the benchmark 10-year Treasury yield remains unchanged.
Given current housing conditions, many homeowners are locked in at low interest rates or unwilling to sell and rebuy due to high home prices, so demand continues to outpace housing supply. This is likely to continue for a while. Housing stock remains at near historic lows, especially entry-level supply, propping up demand and sustaining ultra-high home prices. In the meantime, the monthly supply of new homes, which has been helping to pick up some of the slack, has been slowly but steadily declining since Q4 2022.
Graph 11: Housing Supply; New Residential Permits, Starts and Completes in 000s of Units

Source: US Census Bureau / New Residential Construction Report (all in 000s of Units)
Inventory levels are significantly below historic averages if we consider the population growth in the US since 1999. In addition, the number of new residential home permits that are yet to begin construction has fallen by 15% between January and October 2023 compared to the same period last year (YTD YoY), while new residential starts are down 12% YTD YoY, which suggests the chances of the inventory problem being resolved any time soon are low.
Existing home stock was up 1.8% in October, according to NAR, registering 1.15 million units of inventory. However, even with this uptick, unsold inventory currently sits at a scant 3.6-month supply at the current sales pace. This number is getting closer to many experts’ opinion that a balanced housing market requires 4-6 months of inventory, but levels remain at historic lows. Given these ongoing constraints, home prices can be expected to remain elevated in the short term.
Categories applying continued upward pressure on inflation
In November, Truflation registered significant upward inflationary pressures from food, health, household and daily items, and communication. These have been driven by rising goods supply costs on the one hand, and the tight labor market driving up the services element on the other.
After months of declines in food prices, November saw a reversal of that trend with the food category experiencing a 0.32% MoM increase, which means prices are up 2.5% YoY. The reversal is evident in both grocery prices (food at home) and the cost of dining out (food away from home).
Graph 12: Truflation Food & Beverage Category Price Trends

We had expected to see this reversal of trend in food prices and believe this is likely to continue for the rest of 2023, given the December festive season and the steady increases in labor costs. As we head into 2024, we will likely see a deceleration in inflation but not a decline in food prices.
Food away from home saw an increase of 0.60% MoM in November, while annualized inflation in this category has accelerated to 4.22% YoY. Restaurant operators are keeping menu prices elevated to protect margins amid relentless inflation and, for the most part, consumers have proven willing to accept this. This reversal is likely driven by the festive season and will continue through December. This is also reflected in the retail sales for food services & drinking places, as recorded by the Census Bureau. Growth here has increased by 12.5% YTD in October compared to the same period in 2022 and is up 10.3% YoY.
Meanwhile, food at home continues to be impacted by higher labor and production costs, as well as lower crop yields due to droughts and wildfires, which are all keeping prices elevated.
The household durables and daily use items category has seen an increase of 0.12% MoM and 4.77% YoY. These increases were driven by household operations, where prices increased 11.33% YoY in November, and the single biggest factor behind this trend is the elevated cost of labor.
Graph 13: Truflation Household Durables & Daily Use Items Category Price Trends

The second reason for the upward trajectory is the household furnishings and equipment subcategory, which is up 0.41% MoM. However, on an annualized basis, prices in this subcategory are down 0.44% YoY.
Meanwhile, retail sales of sporting goods and furniture stores have seen a consistent and gradual downward trajectory, but electronic and appliance stores have seen an increase, driven by a rise in semiconductor prices. However, overall this category is likely to follow general goods price trends, with prices slowing down rapidly in the short term.
Graph 14: Household Categories Monthly Retail Sales

Source: US Census Department; Advance Monthly Retail Trade Survey
Healthcare inflation rose again in November, up 0.19% MoM, driven by premium increases, higher deductibles and copays, and soaring prescription drug prices. The average American consumer spends 8.54% of their household expenditure on healthcare, so the impact on the overall CPI is relatively significant. However, on an annualized basis, we are still seeing deflation of -1.24% YoY.
The increases in healthcare costs are driven by several factors, which include:
The way most health insurance companies pay doctors, hospitals, and other medical providers under a fee-for-service system that reimburses each test, procedure, or office visit. This means the more services they provide, the more money they receive, which requires more staff and incurs higher costs, which are passed on to consumers.
- According to the Centers for Disease Control (CDC), 6 out of 10 American adults have at least one chronic disease, which is driving up health insurance costs. A staggering 90% of all healthcare costs – roughly $3.7 trillion annually – go towards treating chronic illnesses and mental health conditions.
- We are seeing more technological advances that improve our health and extend our lives, which leads to increased medical spending and overutilization of expensive technology.
- According to the American Hospital Association, mergers and partnerships between medical providers and private insurers are some of the more prominent trends in the healthcare system. These partnerships allow hospitals to expand service offerings, broaden networks, increase access to specialists, and better serve patients with high-quality care. On the flip side, though, this also reduces individual market competitiveness. Without this competition, these near-monopolies allow providers and insurers to drive up their prices unopposed.
Graph 15: Truflation Health Category Price Trends

As such, while no single reason is to blame for rising health costs, the key drivers are predominately service-related, such as the rising cost of insurance, medical services, and medical supplies. All these increases are being driven by the tight labor market and a general rise in the cost of resources, with these trends looking unlikely to shift anytime soon.
Communications is the final major contributor to the upward price movement with a 0.10% increase MoM and 0.58% YoY. This continues to be driven by residential phone service prices, which rose again in November, up 0.40% MoM and 3.83% YoY.
Graph 16: Truflation Communications Category Price Trends

These price increases continue to stem from the Federal Communications Commission (FCC) permitting carriers to adopt market-based pricing and lifting previous price caps on analog-based services. The latter now offer customers new and improved alternative options, which has allowed them to charge the actual cost of landline services.
Inflation will rise before it comes down
It is widely expected that policymakers will keep interest rates unchanged at the next FOMC meeting, with 97.7% of the market anticipating this outcome, according to the CME FedWatch Tool. At the same time, the Central Bank is also expected to hold rates at elevated levels for longer in the hope that this will be enough to bring inflation down to its 2% target without the need to address the structural issues driving price increases.
However, there are several factors the Fed must consider. Firstly, to bring inflation down to its 2% target policymakers must bring the price of services under control. In fact, service prices must come down by at least 25% to have the desired effect on the overall CPI figure.
This, in turn, means we would need to see a softening of the labor market. So far, the unemployment rate has remained steady and wages have continued their strong growth, beating inflation and potentially fueling the recent consumption boom.
At the same time, rising oil prices would no doubt push up the cost of gasoline and heating oil, filtering through to transportation, construction, and household products. The war in Gaza and the OPEC+ production cuts could have a significant impact on inflation in the future.
Finally, the US is in the middle of a housing affordability crisis. Higher-for-longer interest rates should, in theory, help cool the housing market. However, with an election year fast approaching, the Fed is under a great deal of pressure to start cutting interest rates sooner rather than later, which would have the reverse effect on housing prices.
So what does all this mean for Truflation’s Q4 inflation forecast?
We expect headline inflation to marginally drop this month and then increase again in December, remaining on track for our 3.5% year-end forecast. The consumer-based inflation expectations surveys from the University of Michigan and the Federal Reserve Bank of New York, which represent the sentiment of American households, reveal that consumers expect inflation to remain elevated on a one-year horizon.
Graph 17: Consumer Inflation Expectations (2% is the Fed Target)

Source: Federal Reserve Bank of New York - Survey of Consumer Expectations & University of Michigan Expected Inflation Rate
Looking ahead into 2024, we believe inflation will gradually ease, driven by slowing housing and oil prices and a softening of the labor market. However, the road to the Fed's 2% inflation target will be long and hard.
About Truflation
Truflation provides a set of independent inflation indices drawing on 30+ data partners/sources and more than 12 million product prices across the US. These indexes are released daily, making it one of the most up-to-date and comprehensive inflation measurement tools in the world. Truflation has been leveraging this measurement tool to predict the BLS CPI number, with four predictions spot on and all but one deviating by no more than 20 basis points since coverage was initiated.
APPENDIX A
Category Percentage Change Data; Month-over-Month and Year-over-Year
All Data is Based on October 2023 Data
Truflation
Privacy Policy | © 2025. Truflation - All Rights Reserved.