
Truflation US Inflation Update: September 2024
Published 09 Oct, 2024
Executive Summary
The US economy shows signs of resilience amidst mixed indicators. Q2 GDP growth was finalized at 3%, reflecting robust economic activity. However, inflation is cooling, although consumer behavior is evolving as individuals seek to manage rising costs.
In September, inflation showed slight drops influenced by domestic and global factors, yet recent data indicates an upward trend. The port strike resolution may reignite inflationary pressures affecting essential goods but also a knock on wage acceleration. The CPI forecast for September is projected between 2.2% and 2.4%, with Truflation suggesting a 2.4% YoY rate, following a pattern of monthly deflation.
Key economic highlights include:
- GDP performance: The annualized growth rate remains strong at 3.0% for Q2, though Q3 growth estimates have decreased to 2.5% due to revisions in construction and manufacturing data.
- Consumer Spending: Personal consumption rose 0.2% in August, showing consumer resilience despite a slowdown. Year-to-date spending is up 5.2%.
- Retail Sales: Up 0.1% month-on-month against a significantly strong sales month posted in July. However the picture isn’t as rosy as the numbers suggest with a lot of sectors down with the exception of health and e-commerce bucking the trends. All this while personal savings rates continue to drop.
- Employment: Job additions exceeded expectations with 254,000 jobs in September, reducing the unemployment rate to 4.1%. Key sectors driving this growth include food services and healthcare. This coupled with average non-farm payroll increasing 0.4% month-on-month.
- Consumer Confidence: This continued its rollercoaster ride saw a marginal decline this month reflecting concerns amongst consumers over income growth, labor market softness and the political uncertainty.
Exhibit 1 - US Personal Consumption

Source: Bureau of Economic Analysis
The labor market is evolving, with increasing pressure for better wages. Historical shifts from a labor to investment economies are resurfacing, emphasizing the need for equitable compensation.
With the constant pressures for better wages, the historical shifts from a labor to investment economy are resurfacing, emphasizing the need for equitable compensation. Since 2019 how much did the stimulus of trillions and trillions of dollars (tax cuts, corporate tax rate cuts (35% to 21%) deregulation etc go) back into stock buy-backs vs going into the labor market. Capital and labor need to come together to drive value but capital has been better renumerated in the past decade, but is it now labor that needs to be renumerated better than it has been in the past? This requires negotiations and persistence to drive, and the unions have been making a significant impact - with the most recent port strike being another example of this movement.
The rise of AI presents further challenges as the need to upskill the labor force vs replacing is the biggest challenge. Based on the labor data we are seeing more replacements by organizations. It will affect all jobs and we have to be prepared to improve our skill set and master the tool. It is fast and transformative and will revolutionize our economy faster than globalization.
Despite the high interest rates and inflationary pressures the economy has been resilient and the investor community is increasingly growing more confident that the global economy can achieve a soft landing, with 79% of investors in the Bank of America’s survey optimistic of a soft landing.
Navigating the path to lower inflation will remain challenging especially with the gradual decline in interest rates that the central bank has suggested.
Recent inflation trends
Inflation in the US has been lingering longer than anticipated but is gradually showing signs of slowing, with August's rate at 2.5%. The September figure is expected to reflect a marginal year-over-year decline, although recent data from Truflation indicates a potential reversal of this trend, particularly influenced by rising food and housing costs.
Truflation’s forecast of a 2.4% year-over-year (YoY) CPI for September suggests continued moderation in inflation. This forecast aligns closely with the market expectations, which range between 2.3% and 2.6%. This is the fourth consecutive month of declining inflation as per Truflation, driven largely by falling prices in goods and core components in particular.
Exhibit 2 - Truflation key inflationary metrics: Goods vs Services vs Core Inflation
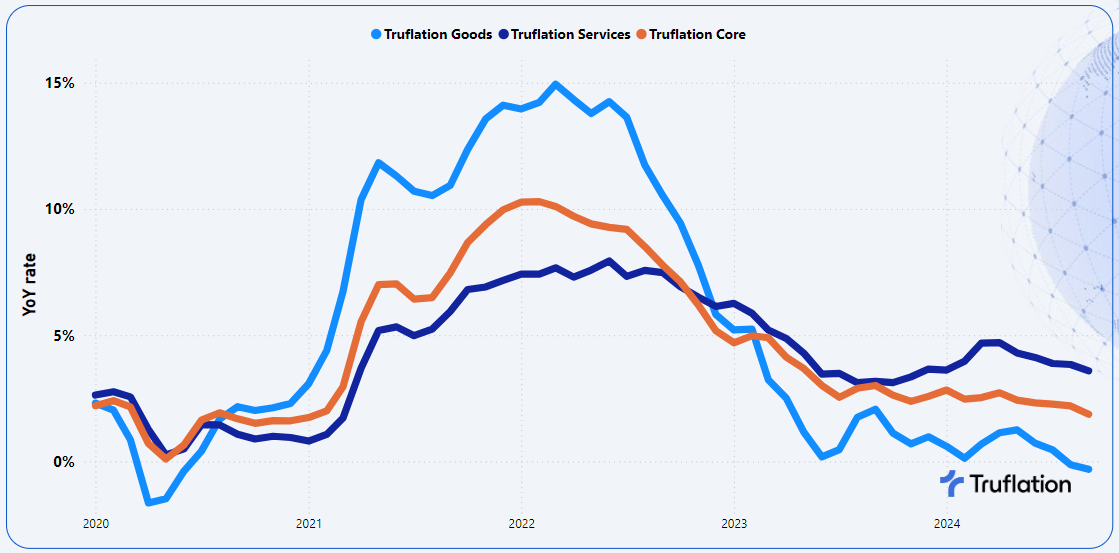
Beyond the macro-economic factors, inflation will also be affected by the tight labor market, the supply-chain constraints, which has been a persistent problem and prices of commodities of food as well as oil. Geopolitical tensions are significant factors that could influence inflation trends and directly affect transportation and production costs. While the rate of inflation is slowing there are concerns for the coming months.
Sector-Specific Inflation Analysis
- Food & Non-Alcoholic Beverages: Prices rose 0.7% MoM and 1.9% YoY, driven by increased commodity prices and labor costs. Trends in out-of-home dining reflect similar pressures, particularly as seasonal travel concludes and consumers return to regular habits.
- Housing: Overall housing costs increased by 0.1% MoM and 1.4% YoY. However, the housing market shows mixed signals, with home sales declining month-over-month and median prices falling 2.4% MoM. Recent decreases in mortgage rates and rising inventory could enhance sales and stabilize prices in the coming months, though hotel prices are climbing due to returning corporate travel and heightened demand linked to the election season.
- Clothing & Footwear: This sector experienced a notable 1.3% increase MoM and 0.9% YoY, attributed to rising costs of commodities, labor, and inventory management, as well as new fall collections hitting stores.
- Transportation: Costs fell by 0.7% MoM but rose 1.6% YoY. Flat vehicle expenses were offset by declining gas prices, a result of lower crude oil costs.
- Utilities: Prices declined by 0.2% MoM and 3.0% YoY, driven by electricity and natural gas. Factors contributing to this is usage as we enter the bridge between summer and winter with the demand cooling compared to the summer months.
Longer term views
The latest data from Truflation indicates an upward trend in inflation during the second half of September, driven by several persistent economic factors. Here's a breakdown of the key elements contributing to this trajectory:
- The volatile food category is likely to see continued increases due to rising commodity prices, alongside higher logistics and labor costs. This will put upward pressure on overall inflation in the short term.
- A tight labor market persists, characterized by significant job growth and a declining unemployment rate. Continued increases in non-farm payrolls suggest that demand for services will remain elevated, which can contribute to inflationary pressures as businesses may raise prices to cover higher wage costs.
- Further rate cuts in interest rates could stimulate economic activity and support growth. Lower capital costs are expected to boost demand, potentially leading to higher inflation. The timing and extent of these cuts will be critical in determining their effects on the inflation landscape.
- Ongoing supply constraints in the housing market, combined with expected interest rate reductions, could create a more favourable environment for first-time homebuyers. This may also drive up home prices if demand remains strong, further impacting inflation.
- The ramp-up in political campaigning is beginning to show effects, particularly in travel and service-related industries. Increased spending on campaigns can influence consumer behavior and spending patterns, adding another layer of complexity to inflation dynamics.
Conclusion
As inflation shows signs of rising again, monitoring these factors will be essential for understanding the broader economic implications. The resilience of the economy, coupled with specific sector pressures, suggests a nuanced path ahead as policymakers navigate interest rates and other economic levers.
APPENDIX A
Truflation Category Percentage Change Data
Month-over-Month and Year-over-Year
All Data is based on September 2024
__
About Truflation
Truflation provides a set of independent inflation indexes drawing on 30+ data partners/sources and more than 14 million product prices across the US. These indexes are released daily, making it one of the most up-to-date and comprehensive inflation measurement tools in the world. Truflation has been leveraging this measurement tool to predict the BLS CPI number, with four predictions spot on and all but one deviating by no more than 20 basis points since coverage was initiated.
Truflation
Privacy Policy | © 2025. Truflation - All Rights Reserved.