Truflation as a Leading Indicator of the Official US Inflation.
Published 17 Feb, 2026
Empirical Evidence of Signal Lead and Regime-Dependent Dynamics Author: Rodrigo Calderón. Date: March 2025. Last Updated: November 2025
Abstract
This overview quantifies and explains Truflation’s systematic lead over the US Bureau of Labor Statistics (BLS) Consumer Price Index (CPI). Using daily Truflation data and monthly US BLS CPI data from January 2020 to the present, we find that:
1. Full-sample analysis shows that the highest correlation occurs when Truflation is shifted ahead of CPI by ~70–75 days. This result reflects a regime-mixing effect caused by the unusually volatile inflation and disinflation cycle of 2021–2023.
2. Segmenting the dataset into three macro regimes reveals a consistent, regime-dependent lead pattern:
● Jan 2020 – Jan 2021: Truflation leads CPI by ~41 days (low inflation)
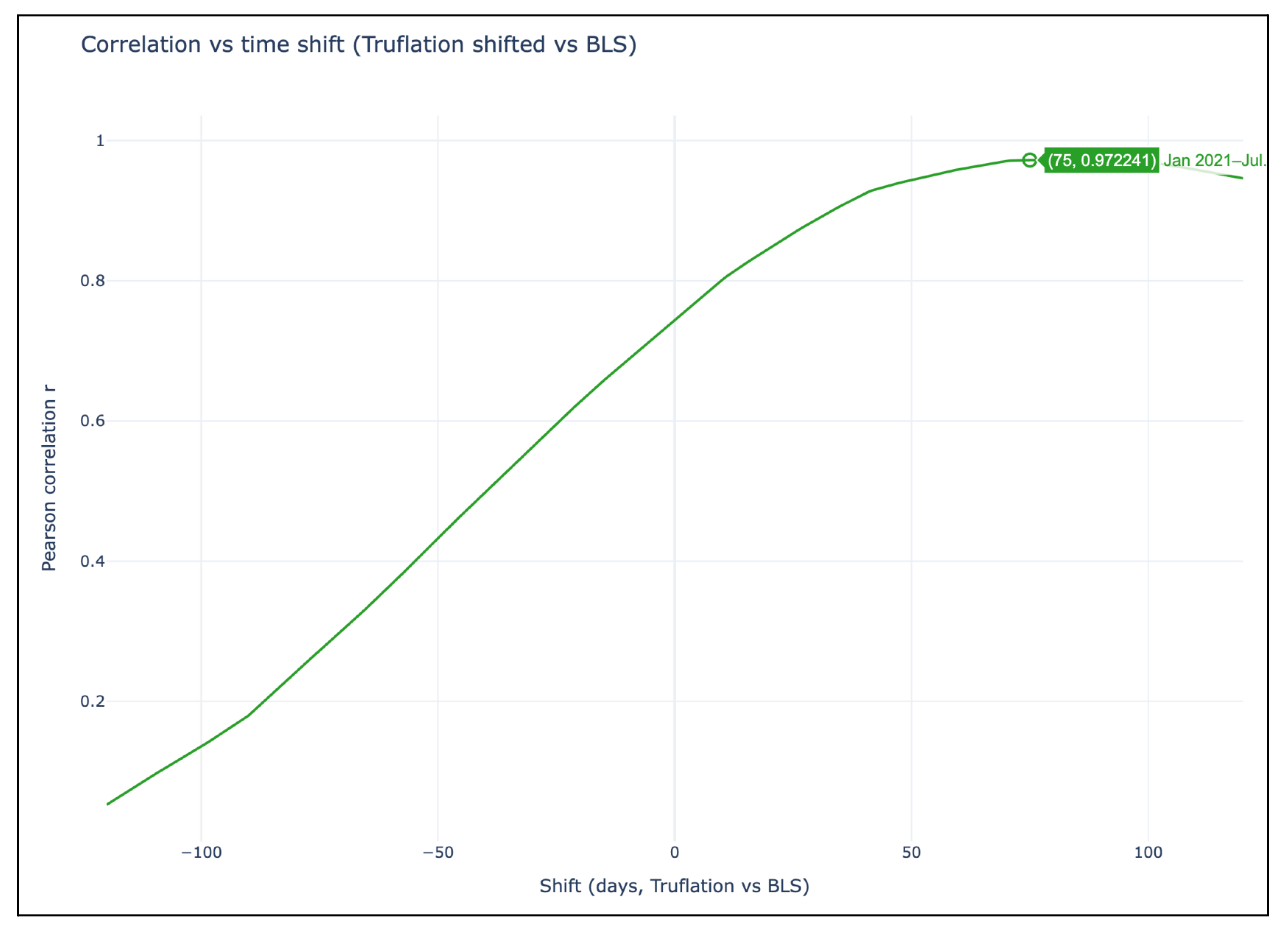
● Jan 2021 – Jul 2023: Truflation leads CPI by ~75 days (high-volatility inflation shock)
● Jul 2023 – Present: Truflation leads CPI by ~41 days (low inflation)
3. These findings show that Truflation’s structural lead is ~40–45 days in low inflation environments, widening to ~70–75 days during rapid price-level shocks. We propose a macro-mechanistic explanation:
○ In low and stable inflation environments, consumer prices adjust gradually and infrequently, meaning that CPI’s monthly cadence is sufficient to keep pace. In these regimes, Truflation still leads, but by a relatively stable 40–45 days.
○ In high-volatility, stimulus-driven inflation spikes and subsequent downturns, retail prices adjust much more rapidly, often daily, while CPI maintains its fixed monthly sampling schedule and smoothing procedures. Truflation captures these fast-moving price changes in real time, causing the gap between the two measures to widen.
As a result, Truflation’s lead increases significantly during these periods relative to the BLS. The evidence demonstrates that Truflation is not just an accurate real-time inflation index but also a structurally leading macro indicator, with implications for forecasting, monetary policy, and inflation-sensitive asset allocation.
The evidence demonstrates that Truflation is not just an accurate real-time inflation index but also a structurally leading macro indicator, with implications for forecasting, monetary policy, and inflation-sensitive asset allocation.
1. Introduction
Inflation measurement lags create a structural blind spot for policymakers, risk managers, and investors. The US BLS CPI, though statistically rigorous, relies on manual price collection, scheduled monthly releases, and revisions. As a result, it is inherently backward-looking.
Truflation was built to solve that constraint. By aggregating millions of daily data points from over 60+ sources (marketplace APIs, utility datasets, insurance data, rental feeds, verified blockchain data, and more), Truflation produces a daily, transparent, real-time inflation index.
A recurring empirical observation among our researchers is that Truflation not only tracks CPI closely but consistently leads it. This brief paper aims to formalize that claim using correlation-based lag analysis across different macroeconomic regimes.
2. Data and Methodology
2.1 Data Sources
● Truflation US Inflation Index: Daily YoY inflation, January 2020 – present.
● BLS CPI-U YoY Inflation: Monthly YoY CPI, January 2020 – present.
2.2 Preprocessing
- Daily Truflation values were kept at their native daily frequency, preserving the full temporal resolution of the index. The BLS CPI values, which are published monthly, were mapped to the actual CPI release dates, rather than to the reference month. For example, the CPI figure for “January 2024” is not assigned to January 2024 in our analysis, it is assigned to its actual release date of February 13, 2024. This approach ensures that the analysis reflects the real-world timing faced by market participants and allows us to measure Truflation’s effective real-time lead relative to the official release calendar.
- For the lag analysis, the daily Truflation series was systematically shifted from –80 to +120 days relative to the CPI release dates. At each shift, the Pearson correlation coefficient was computed between the shifted daily Truflation series and the corresponding CPI values. This procedure yields a correlation-by-shift curve that identifies the day offset at which Truflation aligns most closely with the official CPI trajectory.
3. Results
3.1 Visual Overlap Analysis
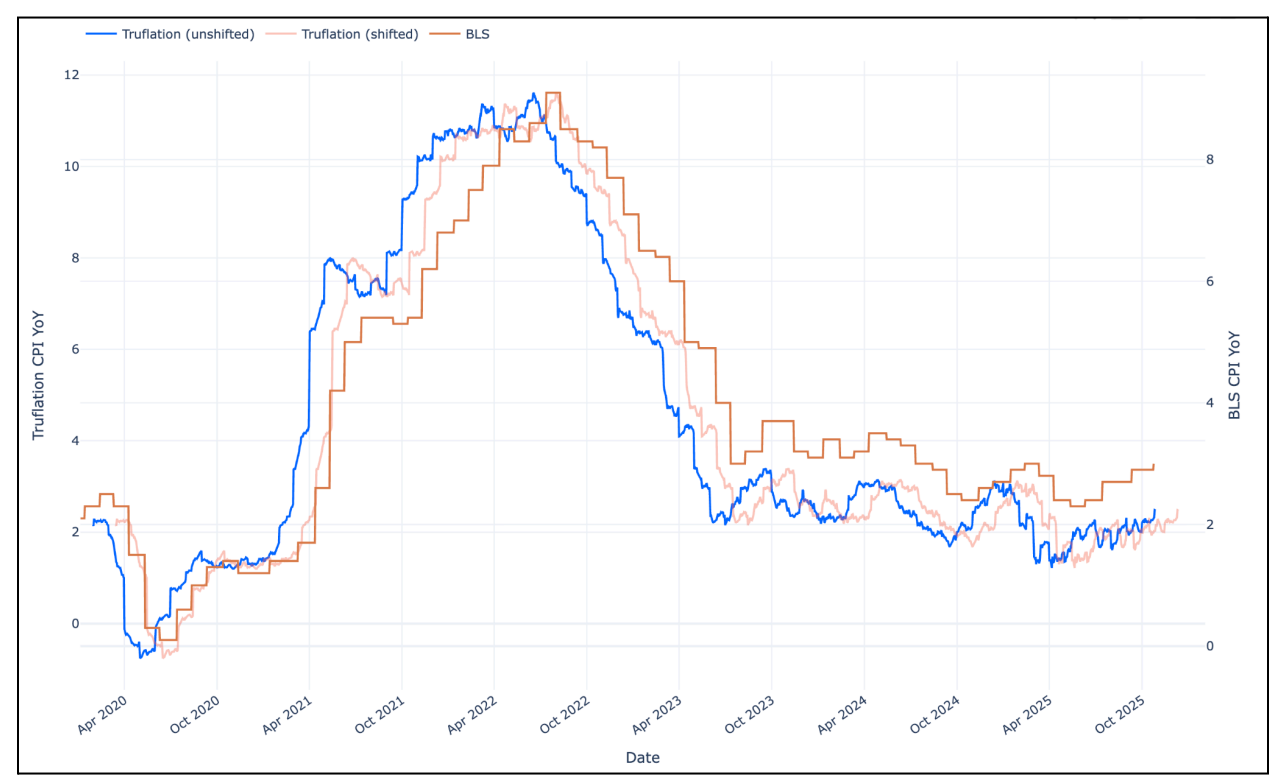
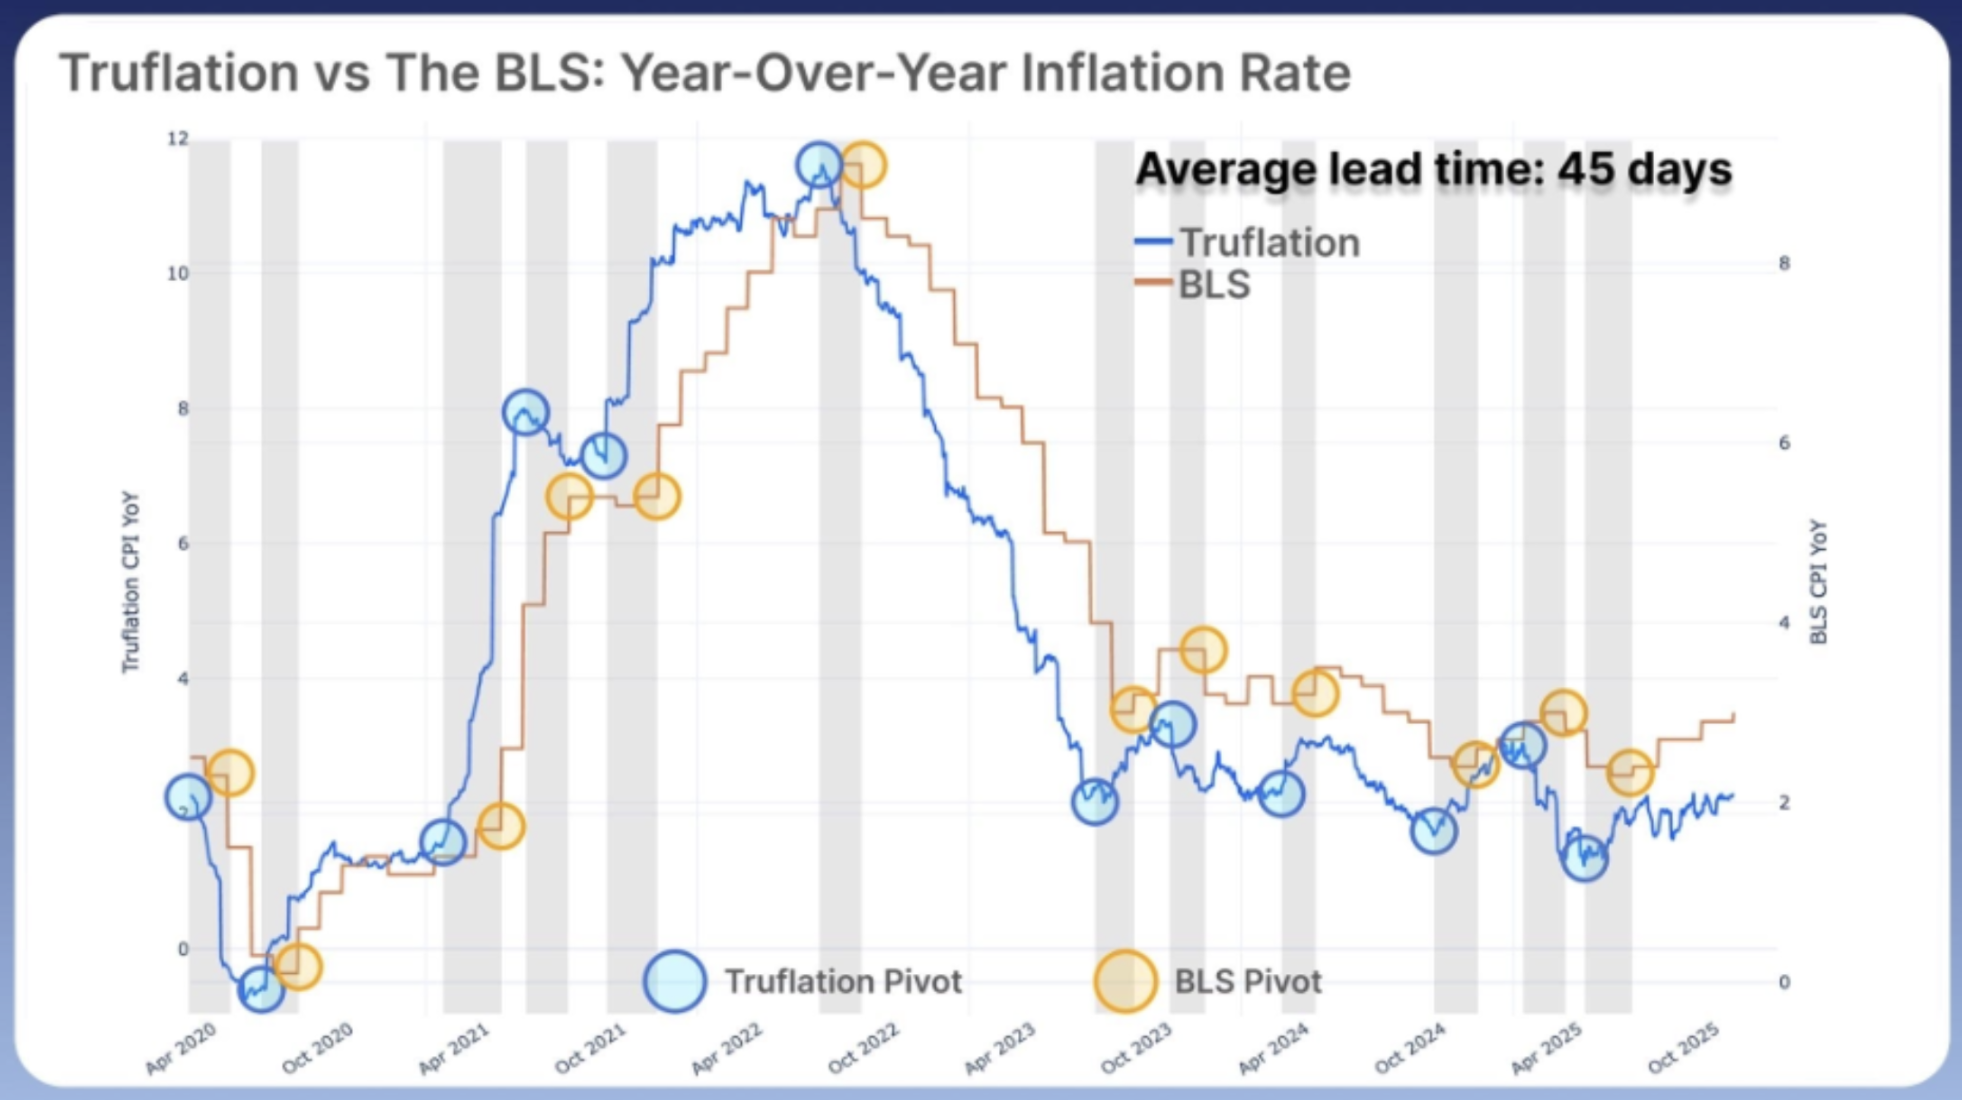
This first graph plots:
- The official government BLS CPI series (in orange)
- The Truflation series (in blue)
- The Truflation series shifted forward by ~45 days (in pink)
Observation:
When shifted by ~45 days, Truflation’s daily YoY trajectory visually aligns with the BLS CPI curve. Peaks, troughs, and turning points are nearly synchronous. This confirms our commonly cited “~45-day lead” from a visual pattern recognition standpoint.
This alignment is especially strong in:
- 2020–2021 (low inflation pre-stimulus period)
- 2023–2025 (post-disinflation environment)
3.2 Full-Period Correlation Curve
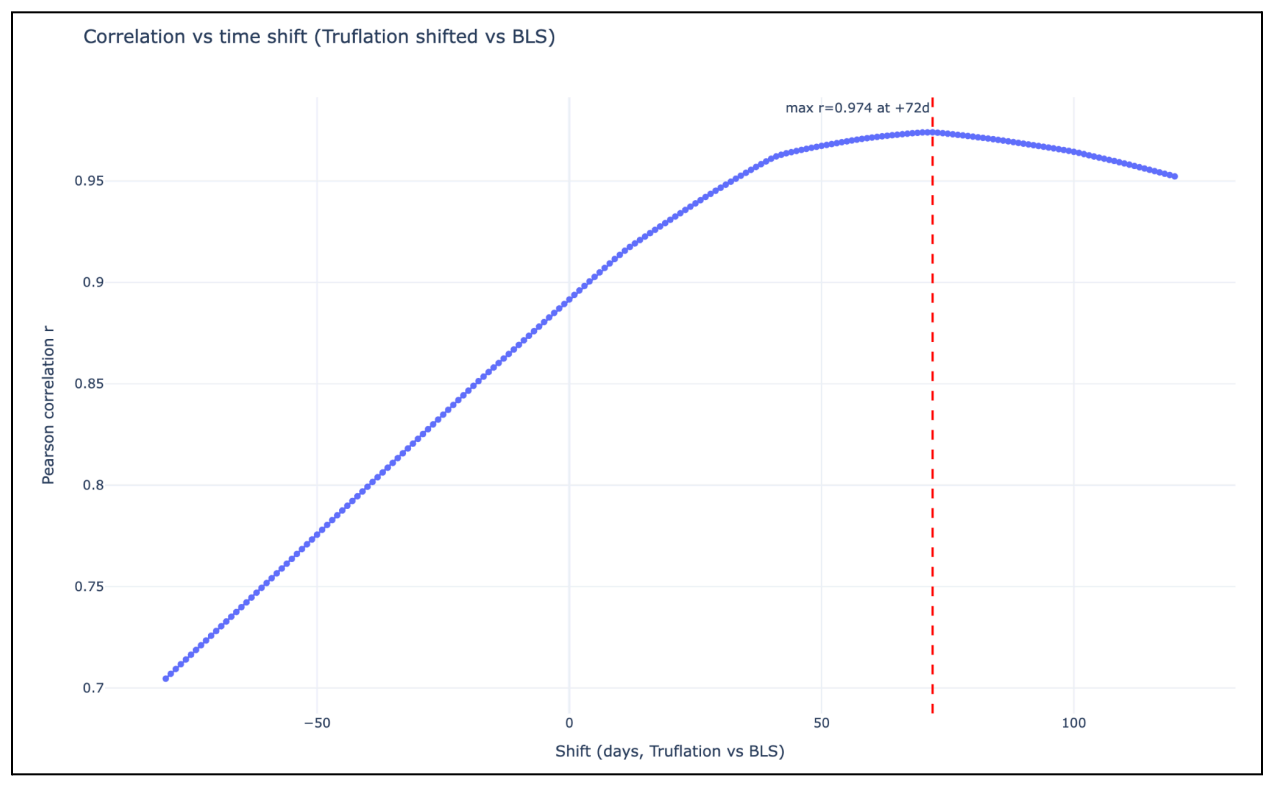
In this second graph, the correlation between Truflation and the BLS CPI is computed across all day-shifts from –80 to +120 days.
,
The highest correlation for the full sample occurs when Truflation is shifted ahead of CPI by approximately 72 days, with a peak Pearson correlation coefficient of r = 0.974.
However, this full-period result must be interpreted with caution. The inflation dynamics of 2021–2023 were highly atypical, characterized by stimulus-driven demand, supply chain disruptions, sharp rent adjustments, commodity volatility, and rapid price increases followed by an unusually fast disinflation phase. These conditions altered not only the speed at which prices rose, but also the speed at which inflation cooled, affecting the entire cycle of price transmission.
As a consequence, the full-sample correlation reflects a mixture of heterogeneous inflation regimes rather than a single structural relationship. The peak at ~72 days, therefore, does not represent a stable underlying lead, but rather an average of fundamentally different macro environments.
3.3 Regime-Specific Correlation Analysis
To correct for the regime-mixing effect observed in the full-period analysis, the dataset was segmented into three distinct macro environments.
Period A: Jan 2020 – Jan 2021 (Pre-stimulus, low inflation)
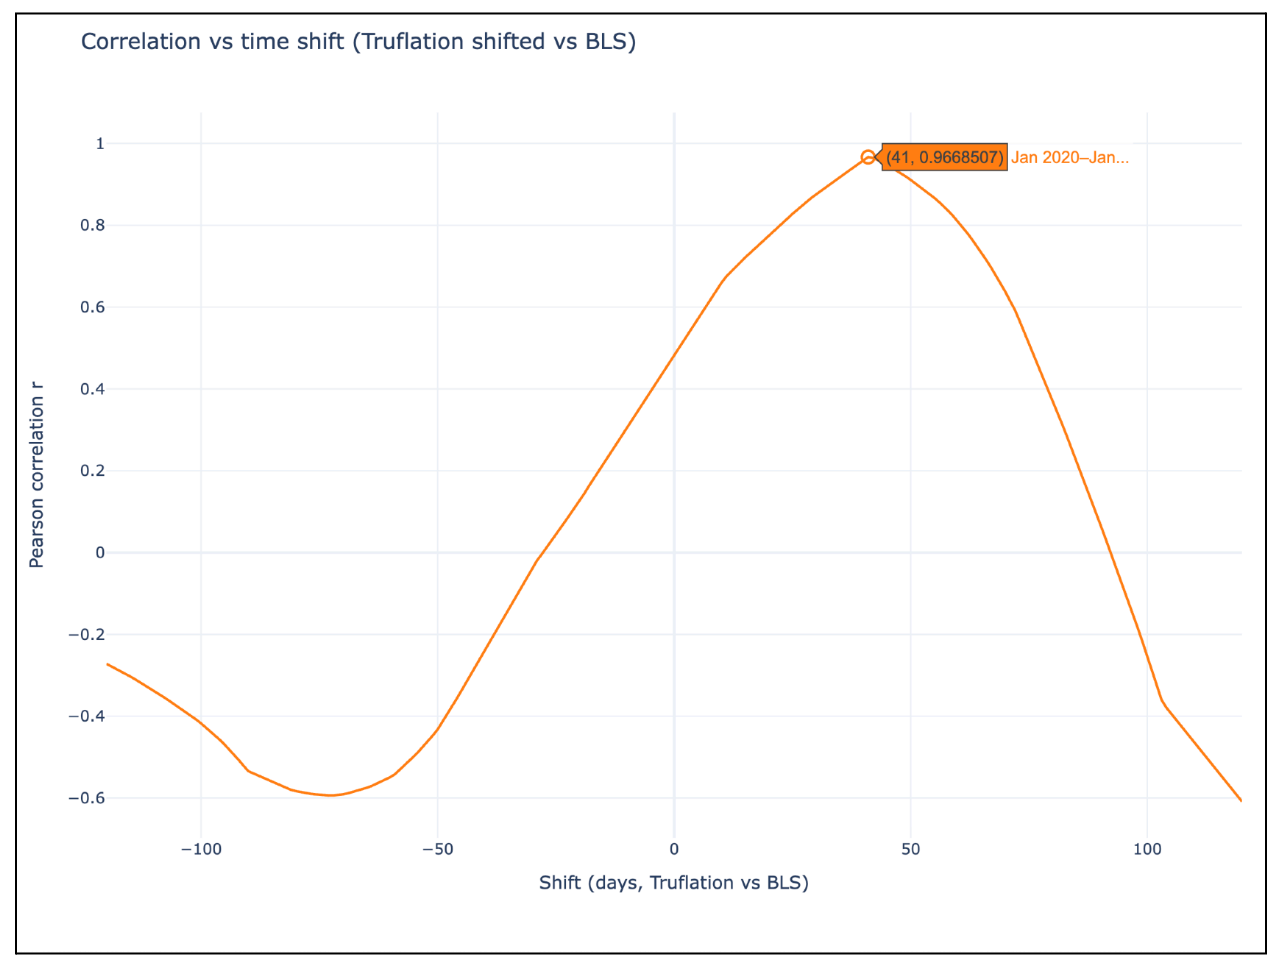
- Low and stable inflation dynamics.
- Gradual, market-driven price adjustments.
- Truflation leads CPI by approximately 41 days.
- Peak Pearson correlation coefficient: r = 0.9647.
This corresponds to R² = 93.15%, meaning that Truflation’s daily series explains roughly 93% of the variation in CPI’s year-over-year movements within this regime.
Period B: Jan 2021 – Jul 2023 (Stimulus-driven inflation)
- Massive fiscal stimulus and demand surges.
- Severe supply chain disruptions and commodity volatility.
- Rapid repricing across goods and services.
- Slow downstream adjustment in CPI components with smoothing (especially shelter).
- Truflation leads CPI by approximately 75 days.
- Peak Pearson correlation coefficient: r = 0.97
This corresponds to R² = 94.09%, indicating that Truflation’s daily series explains about 94% of the variation in BLS CPI’s year-over-year movements during this high-volatility regime.
Period C: Jul 2023 – Present (Disinflation return to normal dynamics)
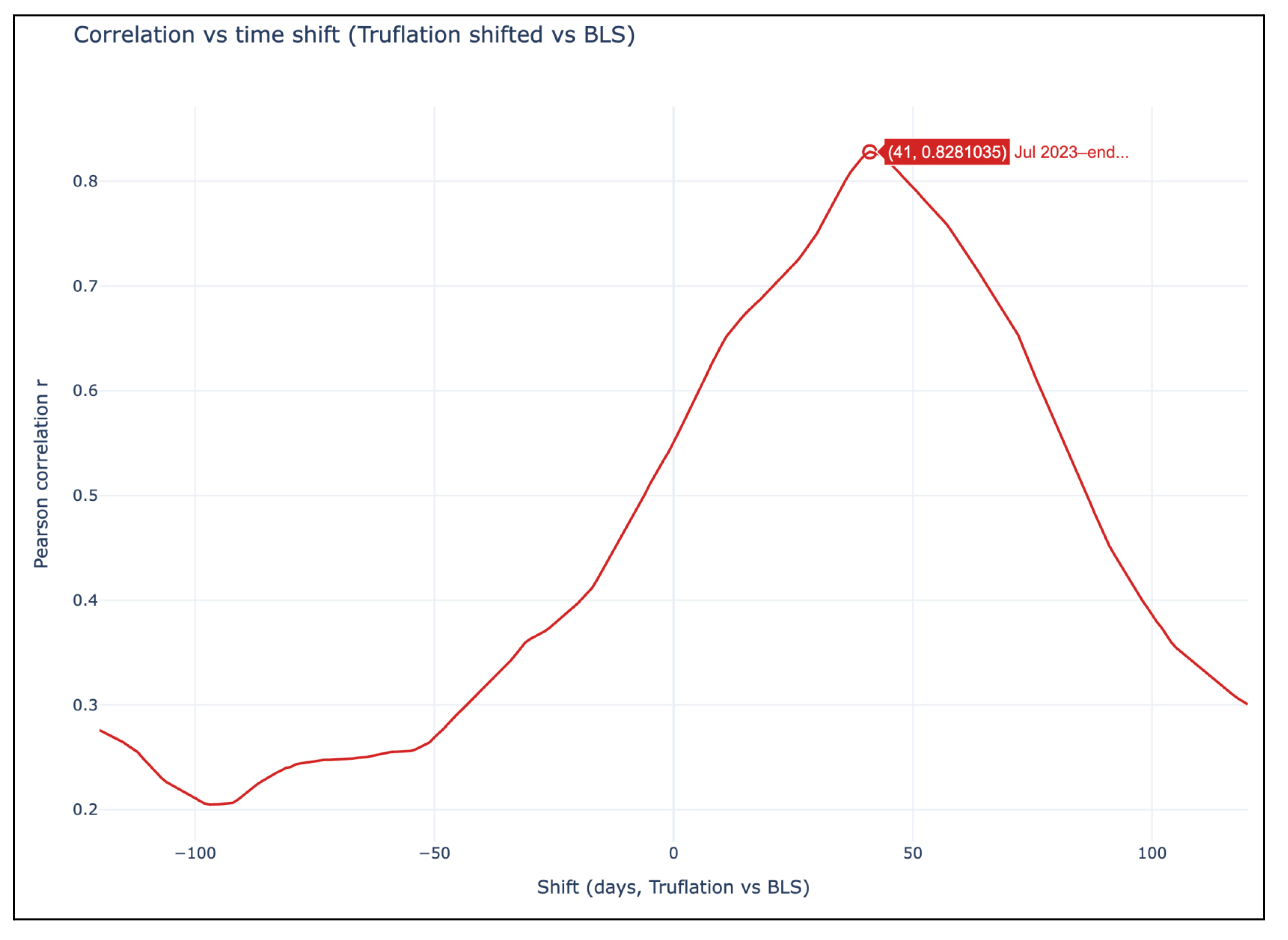
- Inflation stabilizing near ~3%.
- Reduced volatility in price formation.
- Gradual return to pre-shock adjustment dynamics.
- Truflation’s lead returns to approximately 40–45 days.
- Peak Pearson correlation coefficient: r = 0.83.
This corresponds to R² = 68.89%, indicating that Truflation’s daily series explains roughly 69% of the variation in CPI’s year-over-year movements within this normalization regime.
4. Mechanistic Interpretation of the Regime-Dependent Lead
The empirical analysis demonstrates that Truflation’s lead over the BLS CPI is structurally conditioned by the speed of underlying inflation dynamics.
This behavior arises from differences in price-setting frequency, data collection cadence, and smoothing methodologies.
4.1 A stable 40–45 day lead in normal inflation environments
In both 2020–2021 and 2023–present, inflation dynamics were relatively stable. Retail prices changed infrequently and in small increments, allowing CPI’s monthly sampling cadence to track underlying conditions with limited delay.
In these environments, Truflation consistently led CPI by ~40–45 days, reflecting the natural informational advantage of a real-time index relative to a monthly survey-based measure.
4.2 An extended 70–75 day lead during inflation shocks and rapid disinflation
During the 2021–2023 inflation shock, retailers repriced goods far more frequently in response to stimulus-driven demand, supply chain disruptions, and commodity volatility.
This phase was followed by an unusually rapid disinflation, in which underlying price pressures cooled faster than CPI could reflect because of its fixed sampling cadence and multi-month smoothing (especially in shelter).
Across both the upswing and downswing of this high-volatility cycle, Truflation captured real-time price movements immediately, while CPI responded with a delay, widening the effective Truflation lead to ~70–75 days.
4.3 Summary
Truflation’s lead is therefore regime-dependent:
- ~40–45 days in stable macro environments.
- ~70–75 days when inflation accelerates, and during the subsequent rapid disinflation phase.
This regime dependence is a structural feature of real-time inflation measurement.
5. The Case for Truflation as a True Leading Indicator
Across all approaches, visual alignment, full-sample correlation, and period-specific segmentation, the evidence is unequivocal:
Truflation systematically leads CPI turning points in a structural, predictable, and economically meaningful way.
This lead is not incidental; it emerges from core methodological and data-collection differences between the two indices.
5.1 Structural Drivers of the Lead
Truflation’s advance signal is supported by several persistent structural advantages:
- Real-time digital price collection from online marketplaces, utilities, insurance datasets, rental feeds, and other high-frequency sources.
- Millions of daily observations across a broad range of goods and services ● Continuous daily updates, enabling inflation to be tracked in real time rather than monthly.
- Broader and more contemporary coverage compared to traditional survey-based approaches.
- No smoothing or imputation, allowing Truflation to reflect actual market conditions immediately, in contrast to CPI, which applies multi-month smoothing and uses imputed data in several categories.
- Transparent, replicable methodology, with all components documented and publicly accessible. These features create an index that is inherently more responsive to rapid changes in economic conditions, explaining much of its structural lead over CPI.
5.2 Predictive Capabilities
The empirical evidence confirms that Truflation functions as a forward-looking macro indicator:
- Truflation has accurately anticipated CPI releases, often predicting the official figure within ~0.1%.
- It maintains a mean absolute forecast deviation of ~0.1% versus CPI.
- In stable macro environments, Truflation exhibits a consistent ~45-day lead in inflation turning points.
- During extreme volatility, the lead can extend to 70+ days, reflecting faster real-time detection of inflation shocks and rapid disinflation.
These findings underscore Truflation’s utility not only as a real-time inflation measurement tool but as a leading macroeconomic signal with actionable forecasting relevance.
6. Conclusions
This analysis demonstrates that Truflation is a statistically validated leading indicator of U.S. inflation, consistently anticipating CPI turning points across multiple macro environments. The empirical patterns and their underlying mechanisms highlight the structural advantages of real-time, high-frequency digital price data relative to monthly survey-based measurement.
These differences, including update frequency, sampling cadence, sectoral specificity, and the treatment of rapidly adjusting categories, explain why Truflation captures both inflation accelerations and disinflation episodes well before CPI reflects them.
Following the post-2023 normalization of inflation dynamics, Truflation’s lead stabilized once again, underscoring its robustness across disparate macro regimes.
Implications:
The implications for macroeconomic practice are substantial:
- Policymakers gain an early-warning signal for inflation turning points.
- Market participants obtain a forward-looking measure ahead of official CPI.
- Forecasting models improve accuracy by incorporating high-frequency real-time data. Truflation therefore functions not only as a real-time inflation index but as a structural, regime-sensitive leading indicator with meaningful applications in economic policy, financial markets, and quantitative modeling.
Download the Report
About Truflation
Truflation provides a set of independent inflation indexes drawing on tens of data sources and millions of product prices across the US. These indices are released daily, making them the most up-to-date and comprehensive inflation measurement tools worldwide. Truflation has been using this measurement tool to predict the BLS CPI, achieving 99.94% accuracy over the last 12 months.