
Is Inflation cooling enough to keep the Fed on Hold?
Fed Interest Rate Policy Expectation
The Bureau of Economic Analysis (BEA) is scheduled to release the July Personal Consumption Expenditures (PCE) Price Index on Wednesday, August 26. As the Federal Reserve’s preferred inflation measure, the report will be a critical data point for financial markets assessing the likely path of monetary policy over the coming months.
The Federal Reserve is widely expected to leave interest rates unchanged at 3.50%–3.75% at its September meeting, with the CME FedWatch Tool showing a 65% probability of a hold. Looking further ahead, market expectations for a rate hike increase, with roughly 40% pricing in a hike by October and 45% by December.
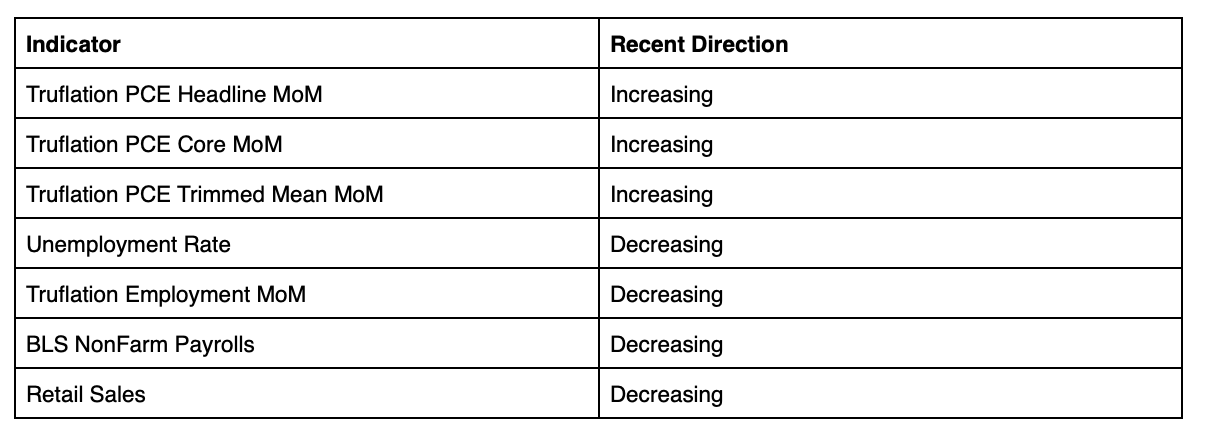
Inflation has cooled in June with the PCE Price Index declining by 0.1% month over month while rising 3.7% year over year. Core PCE, which excludes food and energy, rose 0.1% on the month and 3.3% from a year earlier. This improvement was supported by lower crude oil prices, while core inflation has shown more resilience due to strong consumer demand and a low unemployment rate. However, recent data points to renewed inflation persistence, raising the question of whether current conditions are sufficient to keep the Fed on hold. The current economic scorecard shows the following trends for July:
The Fed’s balance sheet has declined from its pandemic-era highs, but since December 2025 when the Fed introduced the Reserve Management Purchases (RMPs), the balance sheet has increased by roughly $220 billion to $6.759 trillion. If this trend persists, it could become problematic for future inflation, particularly if M2 continues to expand.
In addition, one of Warsh’s key task forces is focused on inflation measurement. This is especially important because a move away from headline and core PCE toward a more timely or accurate inflation indicator could change how the Fed assesses inflation and sets interest rates, potentially giving policymakers more justification to lower rates in the future if the revised framework produces a lower inflation reading. Despite market expectations, Truflation’s view remains consistent: the Fed is likely to leave rates unchanged at the September meeting and is unlikely to hike interest rates during the remainder of the year.
Inflation Rising Again
A key driver of the inflation outlook will be how the conflict in the Middle East evolves and the associated impact on energy prices. The conflict has continued to move between escalation and deescalation, and this may now represent the new normal. As a result, headline inflation is likely to experience monthly volatility depending on the phase of the conflict at any given time.
Oil prices illustrate this volatility. Since the beginning of July, when crude was trading at $69.70 per barrel, prices rose to $93 on July 23, fell back to $76 on August 5 and has since increased again to $86. This is reflected in the Truflation PCE Headline Inflation measure, which has been rising in July, driven by increases in gas and other energy goods, housing and utilities, and recreational goods and vehicles. These components are likely to place further upward pressure on the August reading.
Given the volatility that oil prices introduce, the focus has shifted toward underlying inflation, particularly core and the trimmed mean measures. Waller and Williams have both indicated that they would like to see core inflation running at +0.2% MoM or lower, which would reduce the need for further rate hikes. We saw this in June and expect to see it again in July, but policymakers will likely want to see a more consistent trend, preferably over at least three months, before concluding that inflation is no longer as significant a risk. It is reasonable to assume that this view is shared by a majority of voting members at this point.
There are four areas of growing concern for inflation:
First, tariffs remain a key risk. While tariffs are often treated as a one-time price increase and have historically had a limited inflationary impact, they have become increasingly visible in categories such as apparel and autos. The concern is that repeated changes and new tariff applications, particularly involving China, Canada, Mexico, and the EU, could create a broader and more persistent impact on goods prices. In that case, tariffs would not simply represent a one-off adjustment, but a recurring source of price resets.
Second, the Middle East conflict is affecting more than gasoline prices. While gasoline cooled in June, prices are expected to rise again in July and August based on current oil market dynamics. Higher energy prices also feed into related categories, including jet fuel, freight, goods transportation, and public transportation costs.
Third, wage growth remains elevated. Wages have continued to run at roughly 4.0%–4.5% YoY on a monthly basis over the past year. This suggests that services inflation is likely to remain under pressure, given that labor accounts for a significant share of the services cost base.
Finally, AI is likely to affect inflation through both higher electricity demand and productivity gains that could shift the labor market.Truflation utilities rose +0.98% MoM and +7.64% YoY, the highest readings since mid-2024, underscoring the growing pressure from electricity demand and related infrastructure costs.
Turning to core inflation, Truflation PCE Core and the Truflation PCE Trimmed Mean have both been accelerating. This trend will be a concern for the Fed, given that these measures are closer to the underlying inflation signal policymakers are focused on. By mid-2026, monthly PPI had flattened out, keeping the annual rate near 4.7% YoY. However, if this level remains elevated, it is likely to place upward pressure on consumer prices, particularly if further tariffs raise input costs. The positive development is that longer term econometric projections suggest wholesale inflation should continue to normalize, cooling toward 3.0% in 2027 and a baseline of 2.3% by 2028.
Exhibit 1 - TruPCE Headline, TruPCE Core and TruPCE Trimmed Mean YoY
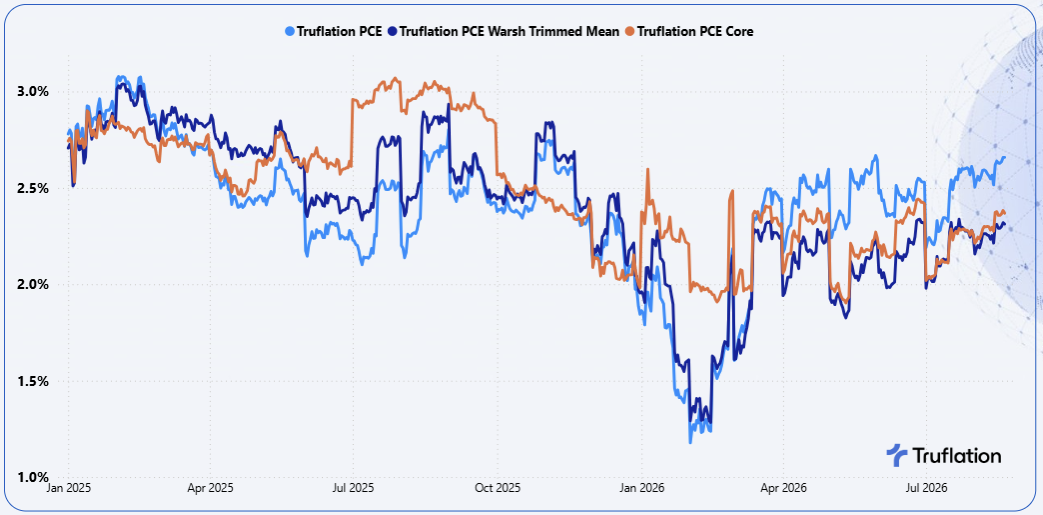
The most consistent categories removed from the Trimmed Mean have been gasoline on the downside and food services and accommodations on the upside. Yet even with these exclusions, underlying inflation is still accelerating. The key inflation trends across these and other material categories are:
Gasoline and other energy goods: -3.36% MoM | +23.60% YoY. The July decline reflects partial relief from crude prices, which eased from earlier peaks, while pump prices stabilized after the worst of the immediate disruption. August data so far has been relatively steady, but with the EIA still expecting Middle East supply constraints to persist through August, energy costs are likely to remain volatile.
Clothing and footwear: -0.70% MoM | +4.24% YoY. July’s decline reflects seasonal discounting as retailers continued clearing summer inventory to make room for the fall assortment. Underlying cost pressure from duties, freight, and sourcing shifts are likely to continue, leaving near term pricing choppy as markdowns clear old inventory and new tariff affected stock enters.
Food services and accommodations: +1.21% MoM | +3.61% YoY. Summer travel demand is the primary driver, with July 4 travel, America’s 250th anniversary events and the World Cup activity lifted hotel occupancy, room rates and away from home dining. Hotels entered July with strong pricing momentum, as June RevPAR posted its strongest year over year gains in several years, while event heavy cities saw additional lodging pressure. Restaurants are still passing through higher labor and operating costs, even as wholesale food costs offered partial relief in July. Continued demand in August is likely to keep pressure elevated through the late summer travel period.
Transportation services: +1.13% MoM | +12.25% YoY. Air travel is the primary driver, with July fares pushed higher by record passenger demand and the continued pass-through of elevated jet fuel costs. Public transportation added a secondary floor, as fare increases implemented across major transit systems earlier in 2026 continued to feed through service prices. With summer travel still strong and airlines focused on recovering fuel cost shocks through fares and fees, transportation services are unlikely to see meaningful near-term relief.
Off-premise food and beverages: +1.09% MoM | +1.91% YoY. Grocery prices rose in July as beef and internationally traded food commodities reintroduced pressure into the basket after several months of more contained food inflation. Beef remained the clearest driver, with environmental impacts and historically tight cattle supplies keeping summer grilling costs elevated despite some consumer substitution toward cheaper proteins. Pressure remains uneven rather than broad based, with easing in categories such as eggs and fats partly offsetting beef, coffee, and crop linked staples.
Mixed Labor Market Signals
The latest employment data shows an unexpected slowdown, but the unemployment rate has also fallen, while wage inflation remains stable. This creates a mixed picture and makes the labor environment harder to assess. There are three key factors to consider:
Recent declines in the headline numbers are not as dramatic as they first appear. One of the main reasons for the decline was a drop in government employment, which economists believe is partly seasonal and may be adjusted in future releases. Private payrolls still increased, albeit at a slower pace, which remains a positive signal for the labor market. At the same time, the unemployment rate fell again to 4.1%, largely reflecting another decline in the number of people employed or actively looking for work.
The shrinking labor force is becoming increasingly important. The participation rate has edged down to 61.4%, falling 0.7 percentage points this year alone as nearly 1.4 million people have exited the labor force. Immigration-related distortions, a higher number of retirees, and growth in gig work may all be affecting the data. This changes how policymakers evaluate labor-market strength: a 4.1% unemployment rate looks less impressive when participation is at its lowest level in 50 years outside the pandemic era.
Wage growth remains a persistent inflation risk. Although year-over-year pay growth, including salaries, hourly wages, and temporary-worker income, has cooled since the pandemic, it has remained in the 4.0%–4.5% range since mid-2025. That level is still high enough to place meaningful pressure on services inflation, particularly in labor-intensive categories, and could keep underlying inflation elevated over the medium term.
Exhibit 2 - Truflation NonFarm Monthly Change vs Truflation YoY Pay growth
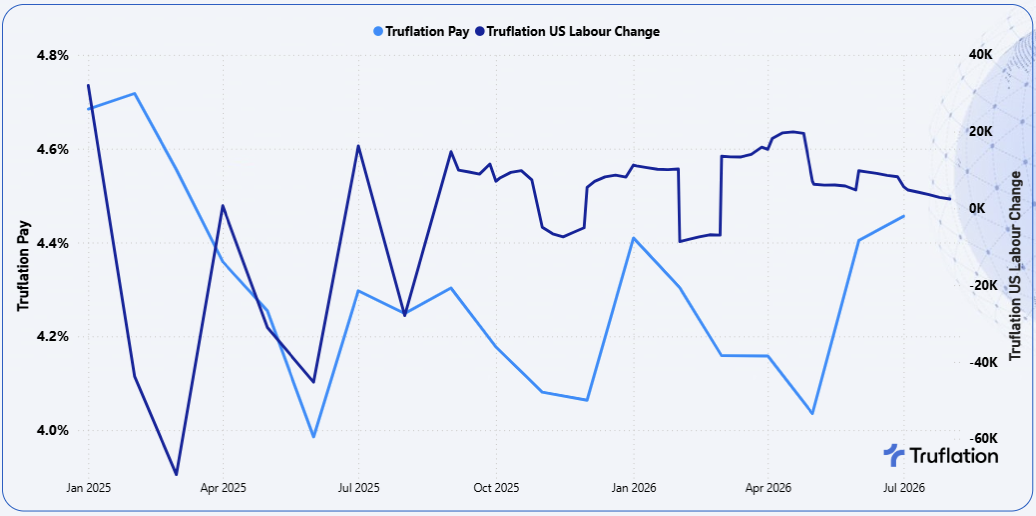
The net takeaway is that the labor market is sending mixed signals on whether the recovery is stalling, but the latest data appears modestly dovish overall. Markets have effectively taken a September rate hike off the table, while Fed policymakers are likely to continue focusing primarily on inflation. Still, weaker pay growth reduces the urgency for a September increase, even if it does not yet provide enough evidence for a clear shift toward easing.
Strain on Consumer Demand?
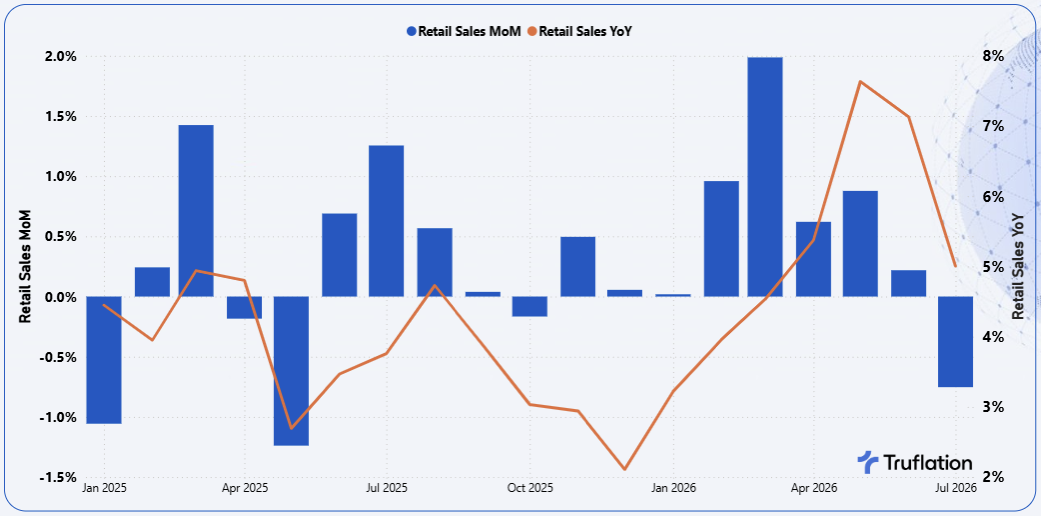
The consumer continues to show resilience, despite the latest retail sales data unexpectedly falling 0.6% in July, marking the first decline in nine months. The drop was likely driven by fading tailwinds from spring tax refunds, higher energy costs, and a more cautious approach to discretionary spending.
Signs of strain are beginning to emerge. Major retailers such as Walmart and Lowe’s have noted that shoppers are becoming more selective and cautious. Walmart posted its slowest sales growth in six years, suggesting that middle- and lower-income households are cutting back as inflation and rising fuel costs continue to pressure disposable income.
Exhibit 3 - Retail Sales Growth MoM & YoY
Outlook & Forecast of PCE for July
Headline inflation should moderate gradually before stabilizing toward the end of the third quarter. Lower energy prices are expected to come into play, depending on the resolution of the Middle East conflict, but the main concern is underlying inflation, which is unlikely to fall meaningfully in the near term.
Inflation risks remain modestly tilted to the upside. As commodity price effects fade, domestic drivers such as services inflation, wage growth, housing and tariff pass-through are expected to play a larger role in the second half of the year. Consumer demand is likely to cool as excess savings decline and households rely more on credit, while slower employment growth should help prevent a renewed inflation acceleration without producing rapid disinflation.
Looking ahead to the BEA release of the July PCE Price Index next week, Truflation expects inflationary pressure to persist, with headline BEA PCE forecast to hold steady at 3.7% year over year and rise 0.19% month over month, broadly in line with market expectations.
Core PCE, which excludes the more volatile food and energy components, is projected to rise 0.2% month over month, with annual core inflation holding at 3.3% year over year. This highlights the continued persistence of underlying price pressures, even as headline inflation remains broadly stable.
About Truflation
Truflation provides a set of independent inflation indexes drawing on 30+ data partners/sources and more than 15 million product prices across the US. These indexes are released daily, making it one of the most up to date and comprehensive inflation measurement tools.
