
View full report in PDF format
Inflation is becoming less benign beneath the headline
August CPI Forecast
Inflation moderated in July, with the BLS CPI headline increasing just 0.1% MoM, following the 0.4% decline recorded in June. On an annual basis, headline eased to 3.4% from 3.5%, while Core CPI increased 0.2% MoM and slowed to 2.5% YoY from 2.6%.
July was therefore a relatively benign inflation report, although much of the improvement in headline inflation reflected falling energy prices rather than a material weakening in underlying price pressure. This distinction becomes particularly important heading into August, as the previous energy drag begins to reverse while tariffs, producer prices and other upstream costs continue to present upside risks.
The inflation picture is becoming more complex and August is no exception. Truflation forecasts that U.S. BLS CPI headline will rise 0.3% MoM in August, while Core CPI will increase 0.2% MoM. If realised this would see headline inflation holding steady at 3.4% YoY with core inflation at 2.4% YoY.
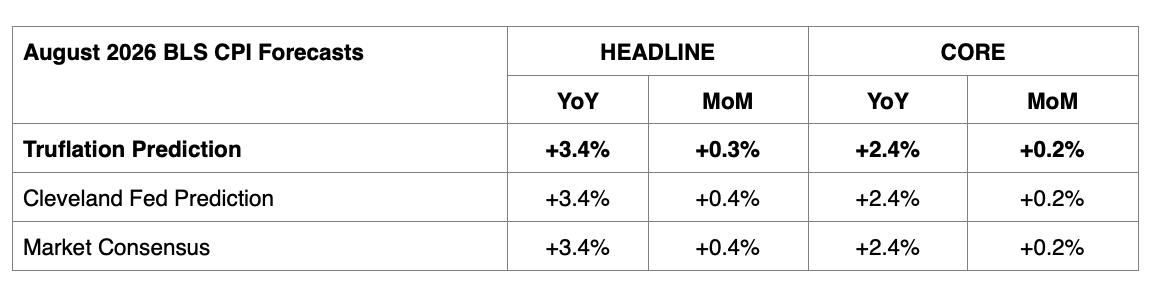
The principal upside risks come from higher energy prices, tariff sensitive goods, elevated manufacturing input costs and persistent services inflation. This upside pressure is reinforced by Truflationʼs real time price data that has historically led movements in BLS CPI by approximately 41 days providing an earlier signal of changes in U.S. inflation momentum.
Exhibit 1: Truflation CPI latest trends compared to the BLS CPI YoY
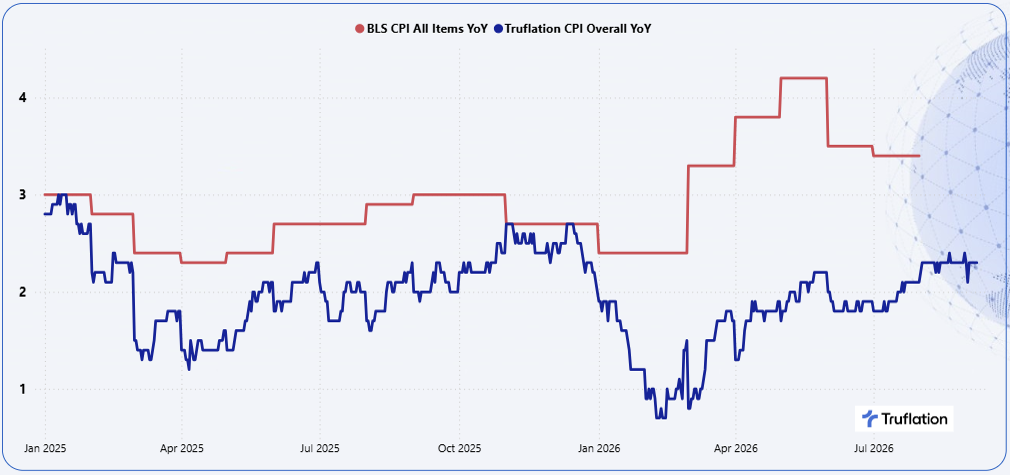
Truflationʼs forward looking signal of where official inflation is heading is reinforced by its strong historical relationship with the BLS CPI. From January 2011 to the present, the two measures have a correlation of 0.955, increasing to 0.962 when Truflation is shifted forward by 41 days. This indicates that Truflation leads the BLS CPI by approximately six weeks on average, although the precise lead time varies across inflation environments and individual expenditure categories.
Category Specific Inflation Drivers: A Diverging CPI Story
The headline inflation rate tells only part of the story. Beneath it, the drivers of inflation are constantly shifting as price pressures strengthen in some categories and moderate in others. Truflationʼs category data allow us to look beneath the headline number, identify where inflationary pressure is building or easing today and provide an early indication of which categories are likely to drive future BLS inflation.
Exhibit 2: Category composition of Truflation CPI YoY
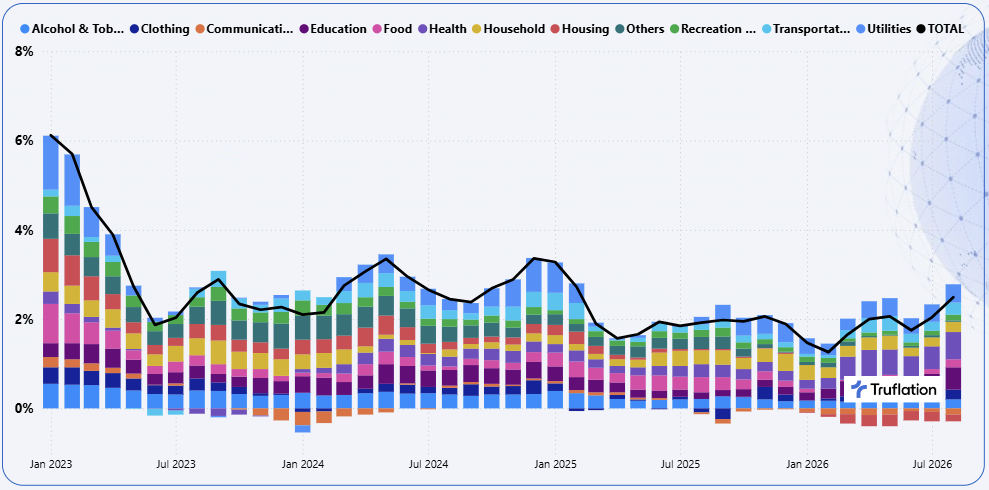
The largest downward contributions to inflation came from Apparel, Communications and Recreation and Culture, while Gasoline and Housing generated the strongest upward pressure. This mix reinforces the broader message: inflation is not accelerating uniformly, but the areas still generating pressure are sticky. That makes the inflation outlook less benign than the headline suggests.
Gasoline: Rising again and Unlikely to See Short Term Relief

Gasoline prices rose +3.4% MoM in August, as elevated crude prices, tight gasoline inventories and limited refinery spare capacity outweighed seasonal relief efforts. The result is a renewed pump price increase even after partial June - July unwind, making gasoline the main upside driver in the headline growth.
Exhibit 3: WTI and Brent Crude Oil Prices remain elevated keeping gas prices high
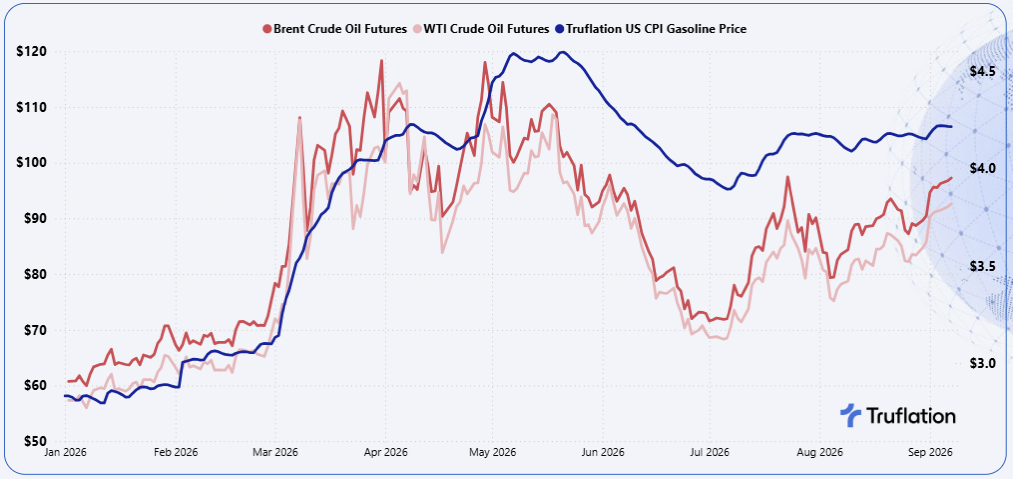
Gasoline is likely to remain the main upside risk to headline inflation in the near term. Retail fuel prices have remained above $4 per gallon and moved above $4.10 in early September, while WTI and Brent crude remain elevated on persistent Middle East supply risk. Combined with tight gasoline inventories, this leaves little buffer against further disruptions, meaning pump prices are unlikely to deliver meaningful relief unless crude prices ease or domestic inventories rebuild.
Housing: A More Stable Housing Market

Housing rose in August because rental inflation reaccelerated while owned dwellings remained constrained by affordability and transaction weakness. The annual decline still reflects the lagged correction in owned housing values, but the monthly reading shows rental pressure returning as the apartment supply wave that cooled rents over the past two years begins to fade.
Owned: Owned dwellings rose only modestly as elevated mortgage rates continued to cap buyer demand and keep transactions subdued. Listing prices remained under pressure, with price cuts still catching up to last yearʼs weak market conditions, suggesting owned housing is stabilizing rather than rebounding sharply.
Rentals: Rentals is the driver as the renter friendly conditions created by the recent apartment construction boom and concessions have started to ease. Asking rents are rising at their fastest pace in more than a year, and while concessions remain common, the balance is shifting back toward landlords as new supply growth slows.
Short-term lodging: Other lodging fell -0.81% MoM despite remaining +2.51% higher year over year, pointing to a seasonal or demand-mix pullback rather than a structural decline. Hotel demand has remained positive in 2026, supported by group travel and resilient leisure activity, but monthly lodging prices can swing as summer travel patterns normalize and event-driven demand fades.
Housing prices are likely to remain split in the near term. Owned dwellings remain capped by affordability pressure, with mortgage rates back in the high-6% range and buyer demand still subdued. Elevated inventory and a rising share of price cuts are weakening seller pricing power, suggesting owned housing is more likely to stabilize gradually than rebound unless mortgage rates come down significantly.
Exhibit 4: Home Sales & Median Sales Prices show a depressed but stabilizing housing market
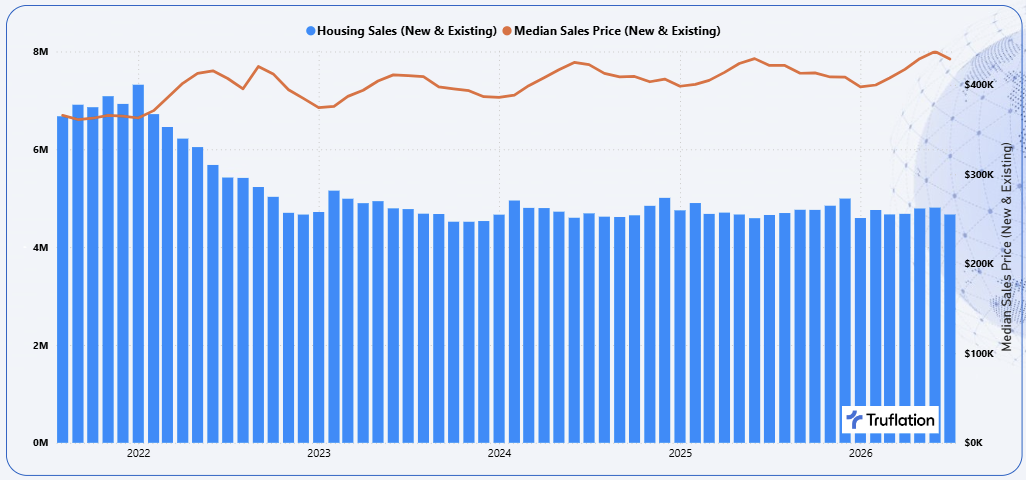
Rental prices are likely to firm up gradually in the near term as apartment construction wave fades, vacancy edge lower and high mortgage rates keep buyers in the rental market. However, widespread concessions that have increased over recent months, combined with elevated supply in the many Sun Belt markets, should cap the pace of rent growth. This means effective rents are likely to rise slower than asking rents.
Exhibit 5: Multifamily vacancy expected to be lower, while concessions are at all time high
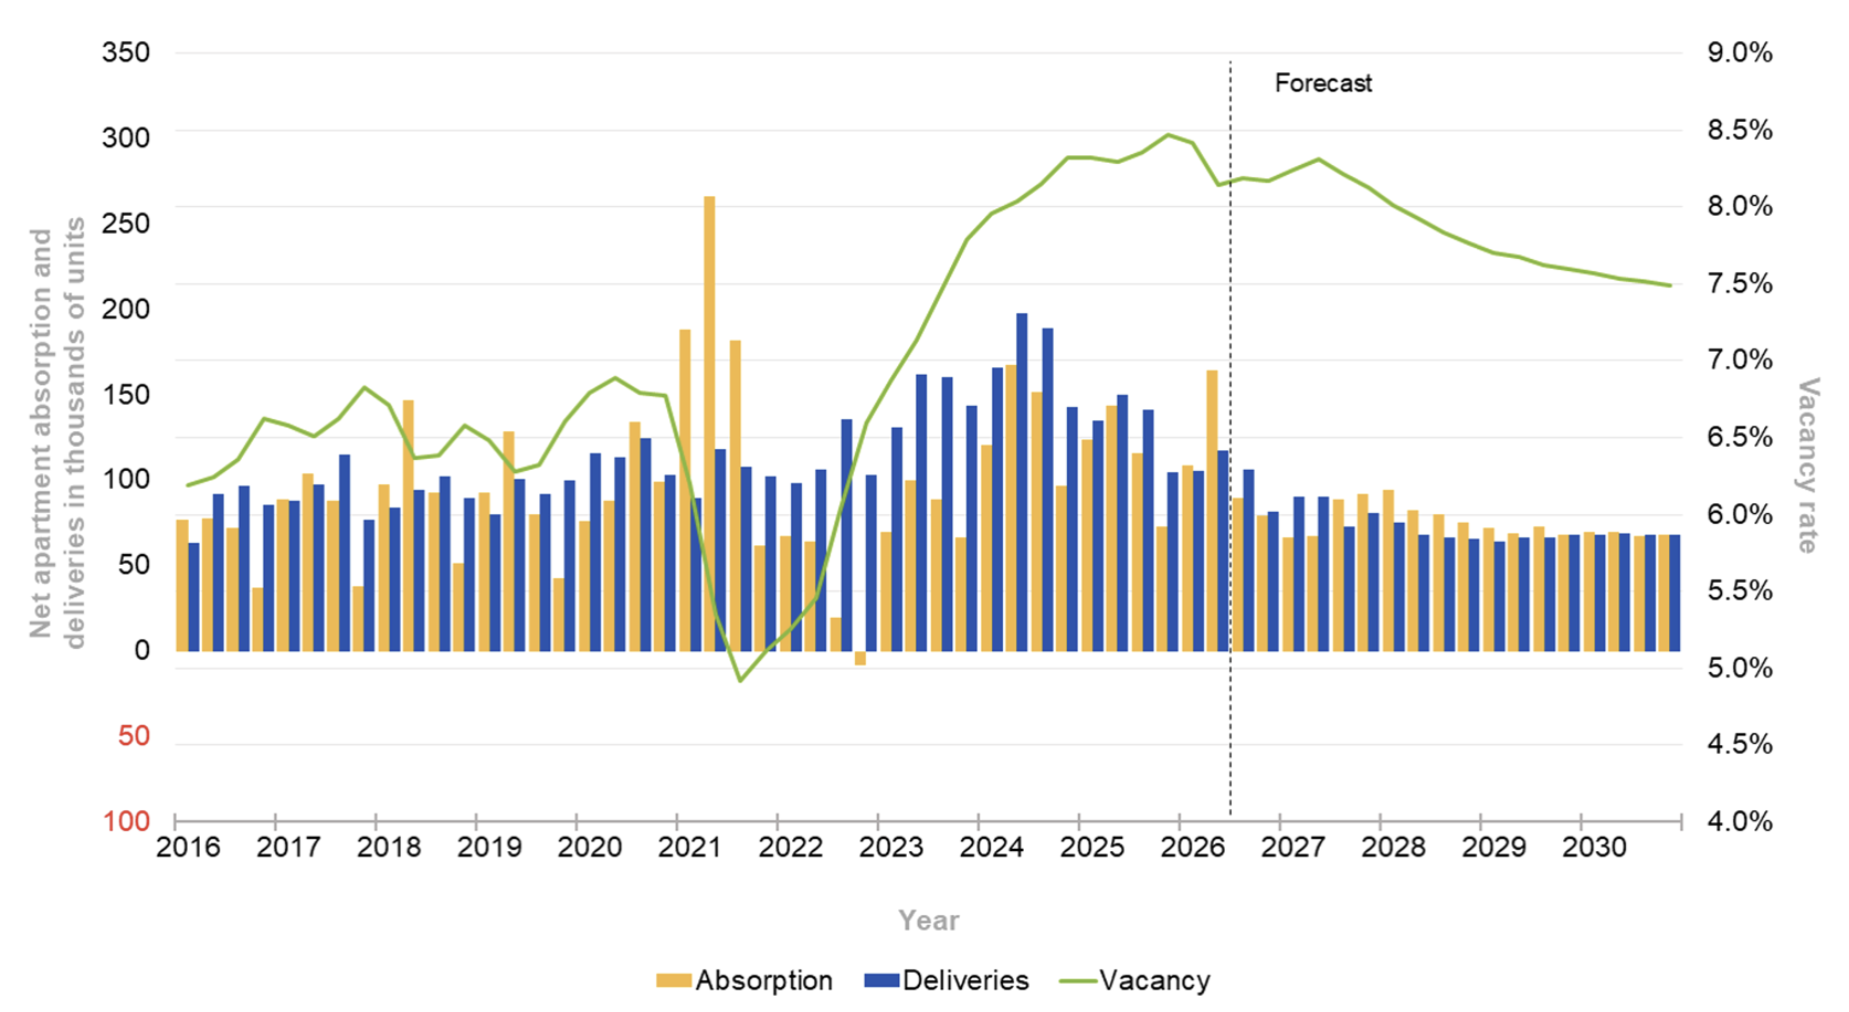
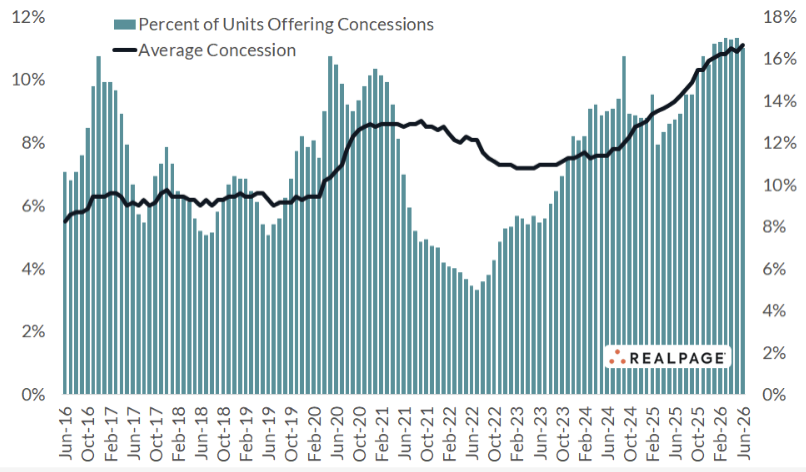
Source: CoStar Group / Real Page
Housing is unlikely to become a clean disinflationary force moving forward. The risk is increasingly tilted to the upside if mortgage rates fall and rental concessions fade.
Food & Non Alcoholic Beverages: Dining Out Remains Firm & Elevated

Restaurant pricing was the main driver, with food away from home rising +0.7% MoM as operators continued passing through elevated food, labor, utilities and occupancy costs. Augustʼs summer travel and back to school shopping trips added seasonal demand, while the reported addition of 59,000 restaurant jobs suggests operators were staffing for firmer activity. However, traffic remains uneven, meaning the increase reflects seasonal demand and sticky restaurant operating costs rather than a broad surge in discretionary dining.
Grocery prices rose more moderately, but tight beef supplies and still elevated wholesale food costs kept food at home from delivering meaningful relief. The split shows consumers are seeing the strongest pressure in prepared meals, where restaurants have less room to absorb cost increases given thin margins.
Food prices are likely to keep rising modestly in the near term, led by food away from home. Grocery inflation should remain uneven, with beef and other supply constrained categories still under pressure, while restaurants continue passing through elevated food, labor, utilities and occupancy costs. Higher gasoline prices could add further pressure through transportation and distribution costs, limiting the scope for meaningful food-price relief unless commodity prices and operating costs ease more decisively.
Communications: Continued Downward Pressure

Cellular service drove the August decline as carriers and MVNOs continued using aggressive plan pricing, handset credits and switching incentives to compete for subscribers. The drop was concentrated in cellular phone service, while residential phone service rose modestly. The structural forces remain deflationary: 5G maturity, prepaid competition and falling effective data costs are allowing consumers to receive more service for lower effective prices. With new entrants and satellite enabled mobile offerings adding further competitive pressure, communications prices are likely to remain under downward pressure.
Apparel: Remains Volatile with New Season Inventories applying upward pressure

Apparel prices fell in August as retailers leaned into back to school and end of summer promotions to clear seasonal inventory and attract increasingly price sensitive shoppers. The monthly decline was concentrated in womenʼs and girlsʼ clothing and childrenʼs apparel, where markdowns tend to be more aggressive around seasonal resets. The annual figure remains positive because earlier tariff and import cost pressures are still embedded in retail price levels, even as short term discounting pulled the month lower.
Exhibit 6: Truflation Clothing & Footwear YoY
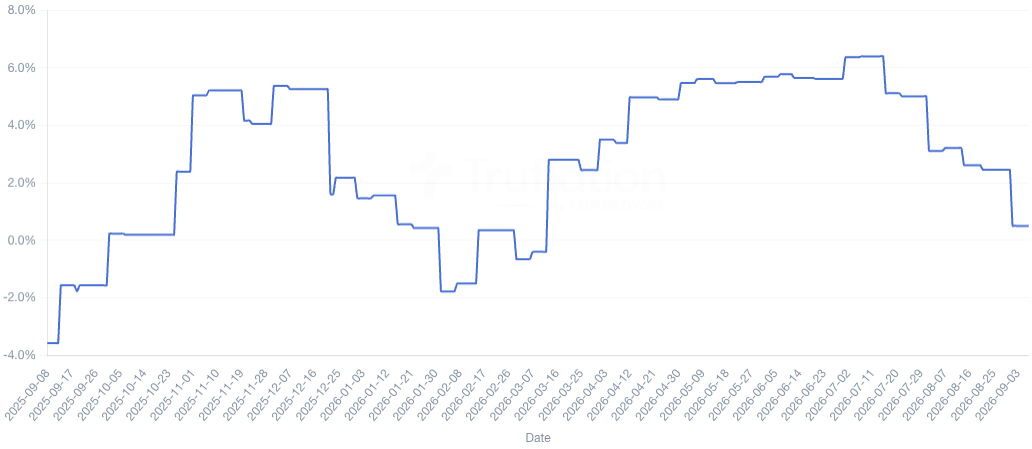
Apparel prices are likely to remain volatile in the near term, with recent
months discounting giving way to renewed pressure as the new season inventories reset at higher landed costs. Retailers are still using promotions to protect volumes among price sensitive consumers, but higher tariff and import costs is likely to keep the annual apparel inflation positive even if month to month readings remain choppy.
Inflation Pipeline: Whatʼs Happening Next?
The next phase of inflation is likely to be shaped by an increasingly divergent outlook for goods and services. As the chart shows, both were major contributors to the 2021-22 inflation surge before moderating significantly, but their trajectories are now beginning to diverge. Truflationʼs data show renewed upward pressure in goods, while services remain comparatively sticky but stable. Looking ahead, the key question is whether rising tariffs, import and producer costs push goods inflation higher, while wage growth, productivity and labor market conditions determine the persistence of services inflation.
Exhibit 7: Truflation YoY Key Inflationary Metrics: Goods vs Services vs Core
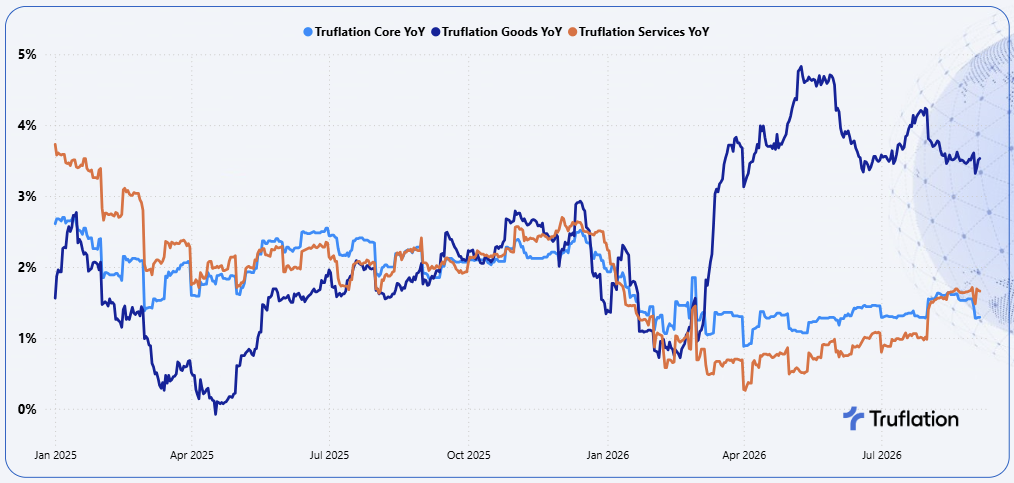
Goods Inflation: Upstream Pressure is Building
While goods inflation remains significantly higher than headline, recent data show it to be more contained at the consumer level as prices have been cooling. However, the upstream inflation pipeline is considerably hotter than the latest consumer data suggests.
As of July, BLS Commodities Less Food & Energy inflation stood at just 0.8% YoY, with New Vehicles at +0.5%, Apparel at +3.9% and Alcoholic Beverages up +2.1% YoY. These key year on year category trends continued to moderate throughout August and into early September.
Exhibit 8: Truflation Key Goods Categories YoY Trends
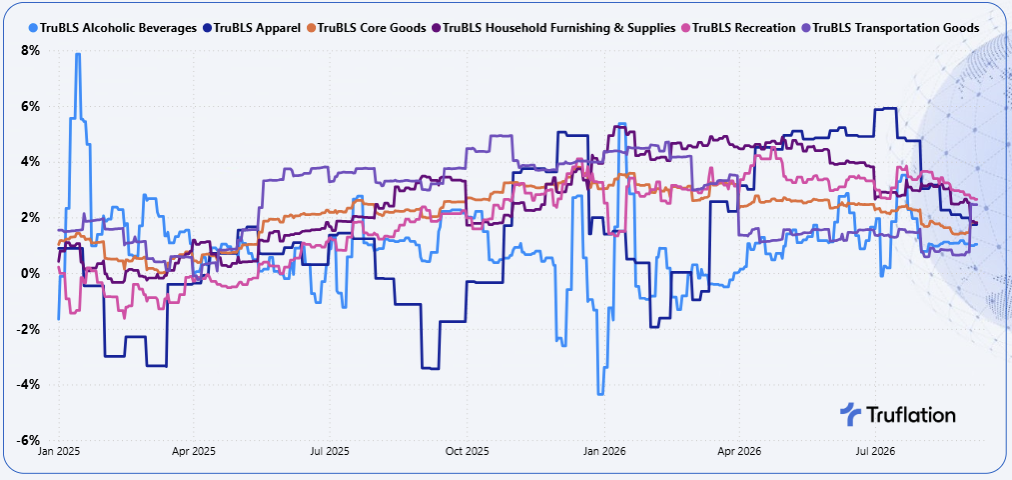
However, several indicators earlier in the pricing chain are pointing in the opposite direction: nonfuel import prices are accelerating, producer goods inflation remains elevated, the ISM Manufacturing Prices Index is above 70 and tariffs continue to raise the landed cost of imported goods.
Tariffs remain an important upside risk. The average statutory tariff rate reached approximately 11.0% in August and, under currently scheduled policy, is expected to rise to 11.8% by year end.
The most recent development is the escalation with Canada as the U.S. placed a 50% tariff on about $20 billion worth of Canadian goods from August 22, and negotiations remain unresolved. Additionally, tariffs on beef have been paused from September 4 for 90 days allowing up to 300,000 metric tons of beef to enter the U.S. without the higher tax rate. The aim is to lower food prices for shoppers while the U.S. works to rebuild its cattle herds.
The inflationary effect is unlikely to be immediate. Importers can initially absorb tariffs through margins, draw down inventories accumulated before tariff increases, renegotiate supplier prices or shift sourcing. However, as inventories turn over, higher landed costs are increasingly likely to be passed through to consumers.
Headline import prices fell 0.4% MoM in July, but this was distorted by a 7.2% decline in imported fuel prices. Excluding fuel, import prices increased 0.4% MoM and 4.5% YoY, their strongest annual increase since 2022. The underlying detail reinforces the message with imported capital goods rising 0.9% MoM, goods from China increasing 0.8% MoM and automotive vehicles and parts increasing 0.2% MoM. Rather than signaling imported disinflation, the underlying data suggest that nonfuel imported goods inflation is strengthening.
Producer prices are substantially hotter than consumer goods inflation. July Goods PPI increased 6.5% YoY, while Core Goods PPI excluding food and energy increased 4.9%. Consumer level core goods inflation is substantially lower, indicating that considerably more price pressure exists upstream than is currently visible at the consumer level.
The ISM Manufacturing Prices Index remained at 71.1 in August, marking the 23rd consecutive month of rising raw material prices. Manufacturers continued to experience pressure from steel, aluminum, imported goods, tariffs and petroleum related costs. Historically, an ISM Prices Index above 52.8 has been associated with increasing intermediate material PPI. At 71.1, the index therefore points to substantial and broad based manufacturing cost pressure.
Truflation's analysis provides further evidence that these upstream indicators contain meaningful relationships with Truflation Goods prices. The Effective Tariff Rate has its strongest correlation with Truflation Core Goods inflation when leading it by approximately four months, at 0.80. ISM Manufacturing Prices reaches a correlation of 0.75 at a six-month lead while Core Goods PPI has a more contemporaneous relationship of 0.57.
Exhibit 9: Upstream Pricing data suggest that Goods Prices will rise before the end of the year.
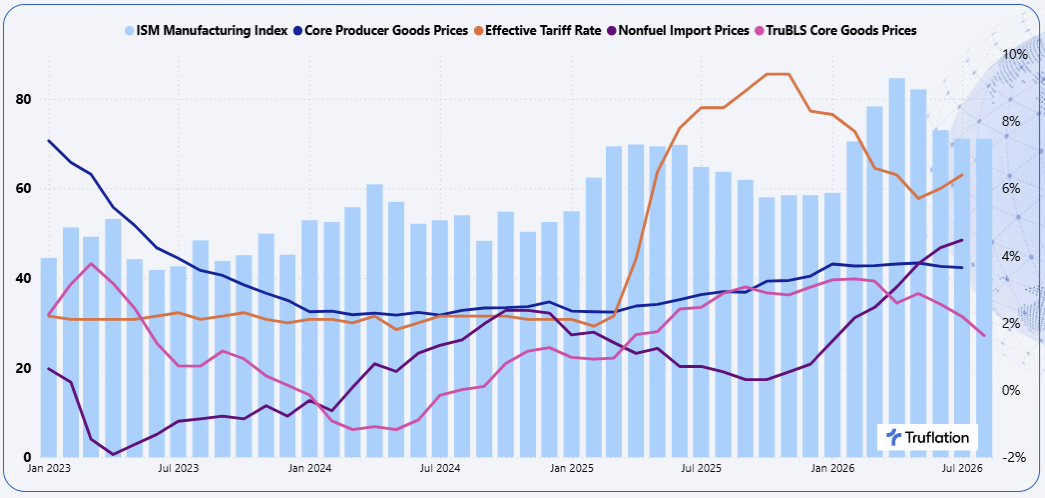
Source: ISM, Bureau of Labor Statistics, Department of Treasury and Truflation
Crucially, Truflation then provides the final link to official inflation. Truflation Core Goods has its strongest correlation with BLS Commodities Less Food & Energy when leading the official measure by approximately two months, with a Pearson correlation of 0.92, compared with 0.83 contemporaneously.
The net take out is that Goods inflation is likely to reaccelerate over the coming months. Tariffs have increased import costs, nonfuel import prices are rising 4.5% YoY, Core Producer Goods inflation is up 4.9% and the ISM Manufacturing Prices Index remains at 71.1. Yet official consumer goods inflation remains relatively subdued.
The widening gap between upstream and consumer prices suggests that additional pass through remains in the pipeline, although recent Truflation high frequency data indicate some near term cooling. This creates an important distinction between the immediate outlook and the medium-term risk: goods prices may remain relatively contained in the next few weeks, while upstream indicators point toward renewed pressure later in the year.
Services Inflation: Persistent, Rather Than Reaccelerating
The outlook for services is more nuanced. The labor market and other cost factors remain relatively stable, and when combined with resilient demand, suggest service inflation is likely to remain persistent.
As of July, BLS services less energy services increased +3.0% YoY, with Shelter at +3.2%, Medical Care +2.7% and transportation services up 2.9% YoY.
These key category trends have been accelerating since July, suggesting continued upward pressure. However, this pressure is not consistent across all services categories due to the varying impact of labor, other operational costs and demand.
Exhibit 10: Truflation Key Services Categories YoY Trends
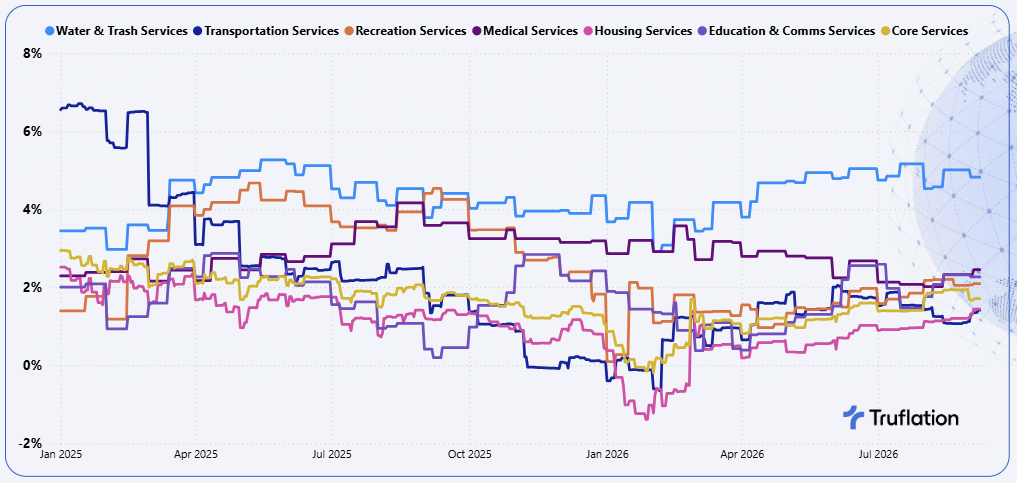
The labor cost backdrop is firm but less concerning than headline wage growth alone suggests because productivity is absorbing part of the increase in compensation. Average Hourly Earnings increased 3.1% YoY in August, while TruPay is running hotter at 4.5%. However, wage growth shouldnʼt be interpreted directly as inflation pressure.
If compensation is increasing around 3.5%-4.0% while productivity is growing around 2.0%-2.5%, the underlying increase in labor costs per unit of output is closer to 1.0%-2.0%. That is considerably less inflationary than looking at wage growth in isolation.
The labor market also appears resilient rather than overheated. August payrolls increased by 162,000, but this followed several weak months. Job openings remain stable, hiring is moderate and quits remain subdued, providing little evidence of the intense worker churn and bargaining pressure experienced during 2021-22.
The complication is that businesses continue to report significant price pressure. The ISM Services Prices Index increased to 72.6 from 70.3, its highest level since August 2022, with rising prices reported across accommodation and food services, healthcare, education, other services and transportation.
If services demand continues to remain resilient, businesses will have greater ability to pass through higher labor and non labor costs. This means services inflation can remain sticky even if unit labor cost growth itself is relatively contained.
Services inflation is therefore likely to remain persistent rather than reaccelerate materially. Healthcare, education, restaurants, hospitality and personal services remain particularly exposed to labor costs, while stronger productivity should limit pass-through in industries where businesses can generate more output per hour worked. The principal upside risks are strong services demand, elevated compensation growth, high non labor input costs and energy/transportation costs.
Forward Inflation Outlook
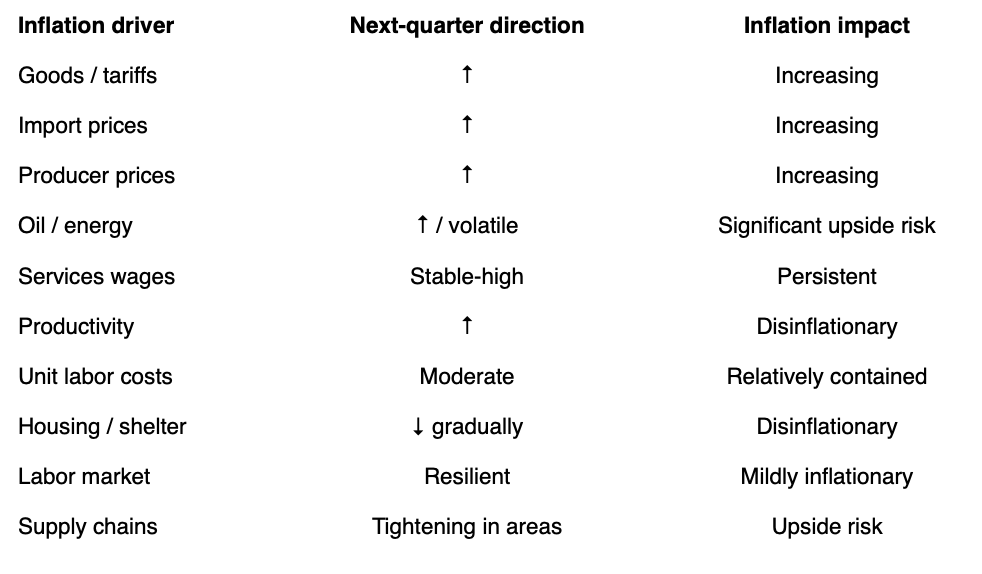
The inflation outlook over the remainder of the year is likely to remain uneven with underlying inflation biased modestly higher, with a growing divergence between goods and services. The key swing factor will be gasoline prices and the extent to which any easing of the Middle East conflict brings crude and fuel prices lower. Our base case is that headline inflation remains in the 3.3%-3.4% range over the quarter, with monthly readings likely to remain volatile at roughly 0.2%-0.4% MoM. Core inflation should remain somewhat more stable, but the composition is likely to shift: goods inflation should gradually accelerate, while services inflation remains sticky rather than materially reaccelerating.
The largest risk is energy. Brent crude is currently close to $97 per barrel, while diesel prices have increased sharply amid renewed tension around the Strait of Hormuz.
The second major risk is tariffs. If the effective tariff rate rises further, or existing tariff costs are passed through more aggressively as inventories turn over, consumer goods inflation could accelerate faster than currently expected. The risk is particularly significant because the upstream indicators already point in that direction.
Wages are a more moderate risk. A renewed acceleration in TruPay would become concerning if it occurred alongside weakening productivity. The combination to watch is not wage growth alone, but productivity adjusted labor costs, which gives a clearer view of unit labor costs. That would be a much stronger warning signal for services inflation.
Housing represents both a downside and upside risk. Faster rental disinflation would pull core inflation lower, while continued strength in housing related expenses such as insurance, utilities and maintenance could slow the decline in shelter inflation.
Other important risks include renewed supply chain disruption, especially in semiconductors, electronics and AI-related equipment; higher food commodity prices; and unexpectedly strong consumer demand that gives businesses greater pricing power.
Exhibit 11: Forecast Balance Inflation driver
Conclusion
The inflation environment is a more complicated mix of renewed goods pressure and persistent services inflation. The principal change is on the goods side. Tariffs, higher nonfuel import prices, elevated producer costs and manufacturing input price pressures increasingly suggest that consumer goods inflation should strengthen over the coming months. Truflation's high frequency goods indicators should capture this pass through ahead of the official BLS data, making them particularly important for assessing how quickly higher upstream costs reach consumers.
Services inflation remains more persistent, but the underlying labor picture is less alarming than wage growth alone would suggest. Rising productivity is absorbing part of the increase in compensation, keeping unit labor-cost growth considerably more contained. This should prevent a renewed wage-price spiral unless wage growth accelerates materially or productivity deteriorates.
Taken together, we expect U.S. inflation to remain above the Federal Reserve's 2% objective for the remainder of this year, with headline inflation likely to remain in approximately the 2.8% - 3.2% range until year end. The balance of risks is tilted to the upside, particularly from oil, tariffs and supply chain disruption. A sustained energy shock or faster tariff pass through could push inflation materially higher, while stronger productivity and reduced energy prices remain the principal downside forces.
September 8, 2026
Truflation
